|

NZD/JPY Price Analysis: Rally capped at Kijun-Sen, at around 88.00

  • NZD/JPY rose from daily lows of 87.03 to test 88.00, though the rally was halted by the Kijun-Sen at 88.49.
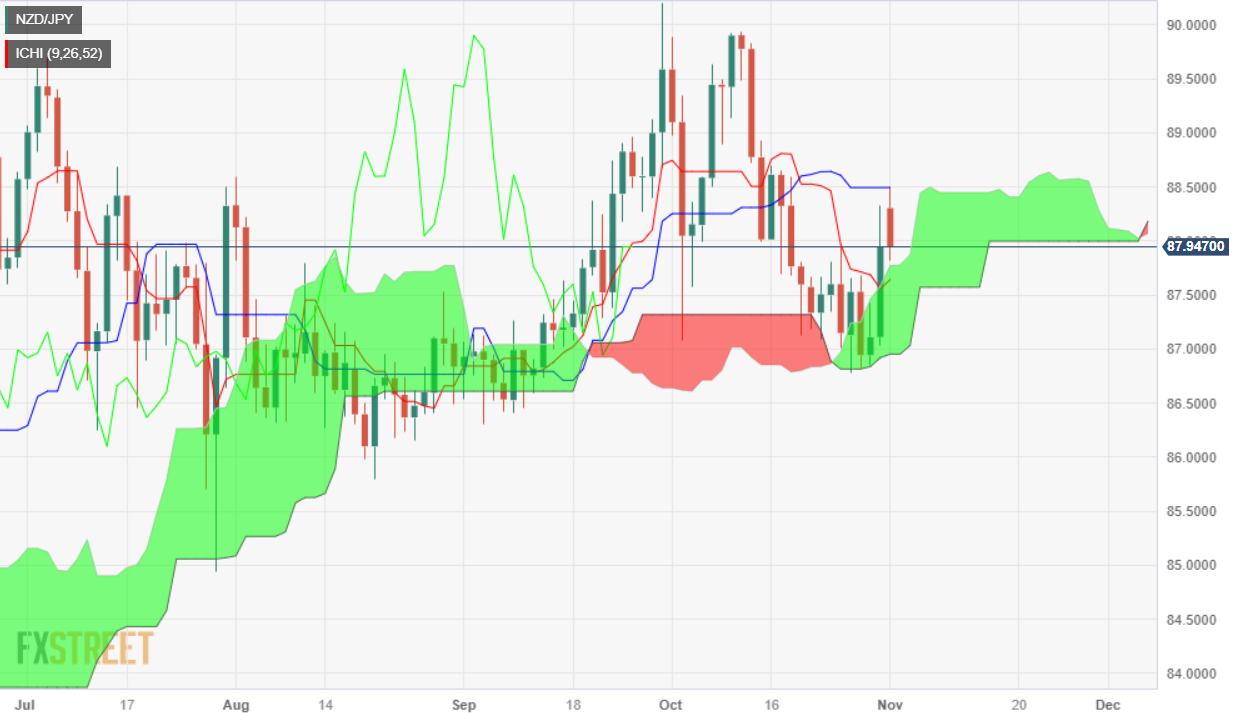
  • On the upside, resistance levels are at 88.00, the Kijun-Sen at 88.49, and the October 11 high at 89.93.
  • Key support levels include the top of the Kumo at 87.82, the bottom of the Kumo at 87.00, and the September 5 swing low at 86.30.

The NZD/JPY jumped from daily lows of 87.03, climbing past the 88.00 figure on Tuesday. However, the advancement was capped by the Kijun-Sen at 88.49, and a seven-month-old upslope support trendline turned resistance, which pushed prices toward the top of the Ichimoku Cloud (Kumo). The pair is trading at 87.89, down 0.48%.

The daily chart portrays the pair as neutral to downward biased, about to break inside the Kumo, which could pave the way for further downside. If NZD/JPY falls below the top of the Kumo at 87.82, that would drive the price towards the bottom of the Kumo at 87.00 before challenging the September 5 swing low of 86.30.

On the contrary, NZD/JPY buyers could remain hopeful if the pair climbs back above the 88.00 figure. A breach of the latter would expose the Kijun-Sen at 88.49, followed by 89.00. A decisive break would expose the October 11 high at 89.93.

NZD/JPY Price Action – Daily chart

NZD/JPY Technical Levels

NZD/JPY

Overview
Today last price87.94
Today Daily Change0.83
Today Daily Change %0.95
Today daily open87.11
 
Trends
Daily SMA2088.18
Daily SMA5087.73
Daily SMA10087.64
Daily SMA20085.73
 
Levels
Previous Daily High87.42
Previous Daily Low86.84
Previous Weekly High87.95
Previous Weekly Low86.78
Previous Monthly High90.21
Previous Monthly Low86.3
Daily Fibonacci 38.2%87.2
Daily Fibonacci 61.8%87.07
Daily Pivot Point S186.83
Daily Pivot Point S286.55
Daily Pivot Point S386.25
Daily Pivot Point R187.41
Daily Pivot Point R287.7
Daily Pivot Point R387.99

Author

Christian Borjon Valencia

Christian Borjon began his career as a retail trader in 2010, mainly focused on technical analysis and strategies around it. He started as a swing trader, as he used to work in another industry unrelated to the financial markets.

More from Christian Borjon Valencia
Share:

Markets move fast. We move first.

Orange Juice Newsletter brings you expert driven insights - not headlines. Every day on your inbox.

By subscribing you agree to our Terms and conditions.

Editor's Picks

EUR/USD climbs toward 1.1800 on broad USD weakness

EUR/USD gathers bullish momentum and advances toward 1.1800 in the second half of the day on Tuesday. The US Dollar weakens and helps the pair stretch higher after the employment report showed that Nonfarm Payrolls declined by 105,000 in October before rising by 64,000 in November.

GBP/USD climbs to fresh two-month high above 1.3400

GBP/USD gains traction in the American session and trades at its highest level since mid-October above 1.3430. The British Pound benefits from upbeat PMI data, while the US Dollar struggles to find demand following the mixed employment figures and weaker-than-forecast PMI prints, allowing the pair to march north.

Gold extends its consolidative phase around $4,300

Gold trades in positive above $4,300 after spending the first half of the day under bearish pressure. XAU/USD capitalizes on renewed USD weakness after the jobs report showed that the Unemployment Rate climbed to 4.6% in November and the PMI data revealed a loss of growth momentum in the private sector in December. 

XRP dips as bearish pressure persists despite ETF growth

Ripple is finding footing above $1.90 at the time of writing on Tuesday after a bearish wave swept across the broader cryptocurrency market, building on persistent negative sentiment.

Ukraine-Russia in the spotlight once again

Since the start of the week, gold’s price has moved lower, but has yet to erase the gains made last week. In today’s report we intend to focus on the newest round of peace talks between Russia and Ukraine, whilst noting the release of the US Employment data later on day and end our report with an update in regards to the tensions brewing in Venezuela.

BNB Price Forecast: BNB slips below $855 as bearish on-chain signals and momentum indicators turn negative

BNB, formerly known as Binance Coin, continues to trade down around $855 at the time of writing on Tuesday, after a slight decline the previous day. Bearish sentiment further strengthens as BNB’s on-chain and derivatives data show rising retail activity.