|

NZD/JPY Price Analysis: Cross consolidates near 88.00

  • NZD/JPY moves sideways after a three-day winning streak, and mixed technical signals emerge.
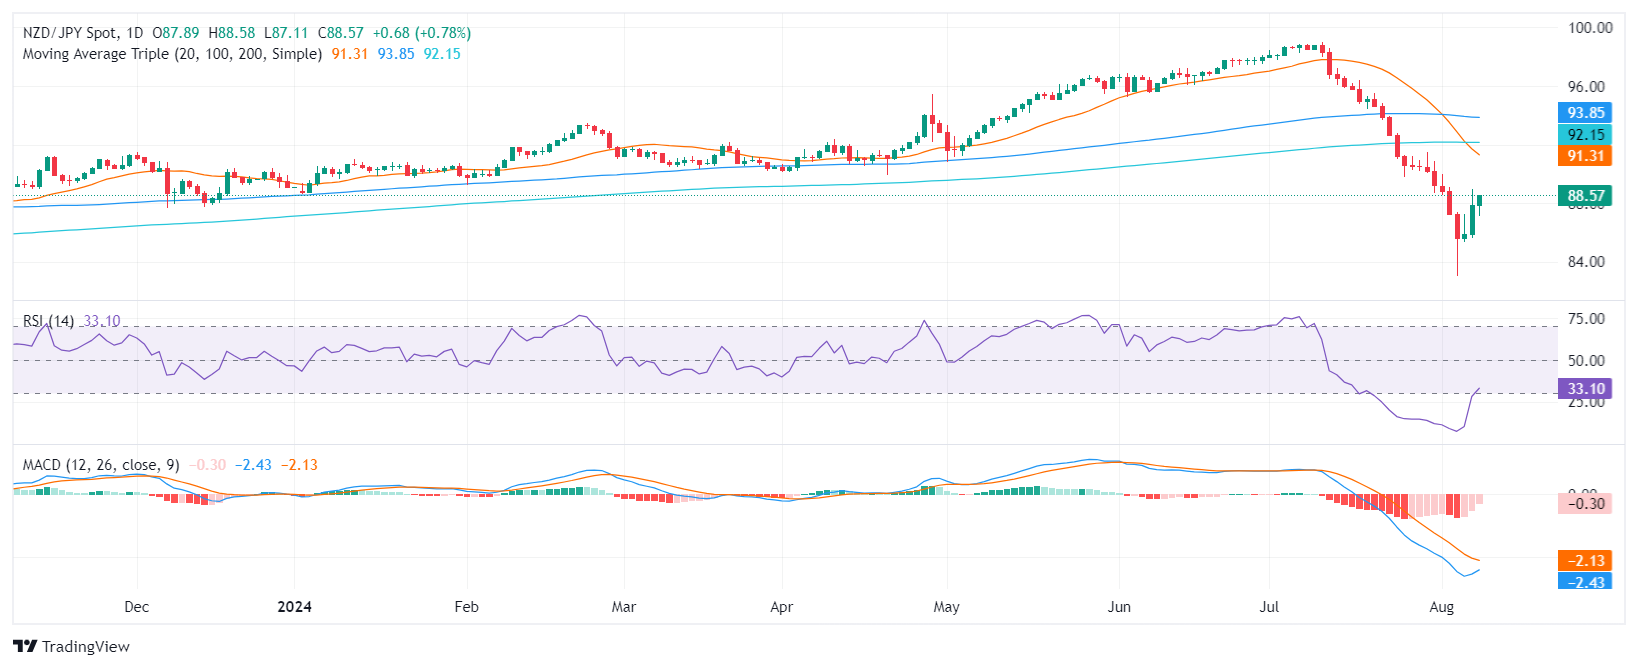
  • The RSI remains near the oversold area despite rising, and the MACD prints decreasing red bars.
  • Shrinking volume suggests that the selling pressure is waning, indicating a potential reversal.

The NZD/JPY currency pair remained in a consolidation pattern on Friday, hovering around the 88.000 level. While the pair has experienced a three-day winning streak, technical indicators present contrasting signals, and the pair is set to side-ways trade.

From a technical standpoint, the Relative Strength Index (RSI) indicator is currently at 30, indicating that the pair is still in the oversold area. This suggests that there could be further room for recovery. The Moving Average Convergence Divergence (MACD) indicator, on the other hand, is showing decreasing red bars, which could signal a stagnation of the selling pressure. Trading volume has decreased in recent sessions, which could indicate that selling pressure is easing. This is a positive sign for the bulls, as it suggests that they may be gaining some momentum. 

The bulls are attempting to push the pair higher towards the 88.50 resistance level and if they succeed in breaking above this level, it could open the door to further gains toward the 89.00 area. However, if the bears regain control and push the pair below the 88.00 level, it could lead to a deeper correction towards the 87.50-87.00 support zone.

NZD/JPY Daily chart

Author

Patricio Martín

Patricio is an economist from Argentina passionate about global finance and understanding the daily movements of the markets.

More from Patricio Martín
Share:

Editor's Picks

GBP/USD bounces back above 1.3200 despite political drama in UK

GBP/USD extends the rebound above 1.3200 in the second half of the day on Friday but the pair is still down more than 1% for the week. Stronger-than-expected UK Retail Sales data seem to be helping the British Pound limit its losses, while the chaotic UK political environment keeps the bulls at bay.

EUR/USD recovers above 1.1450 on USD pullback

EUR/USD rebounds from the three-month low it touched below 1.1420 and holds above 1.1450 in the second half of the day on Friday. Still, the cautious market mood on growing uncertainty surrounding the next round of US-Iran talks makes it difficult for the pair to gather momentum.

Gold remains below $4,200, looks to post weekly losses

Gold struggles to gather recovery momentum and trades below $4,200 in the American session on Friday, pressured by the hawkish Fed tone and the renewed uncertainty surrounding the next round of US-Iran talks. Despite the bullish action seen in the first half of the week, XAU/USD remains on track to close in negative territory.

Solana extends correction despite ETF inflows, RWA adoption

Solana (SOL) price edges below $70 extending its losses for the fourth straight day this week. The institutional demand for Solana is building, with steady inflows so far this week and Morgan Stanley’s amended S-1 filing for a Solana-focused Exchange-Traded Fund.

The Iran war didn't break the US economy, but what happens next?

Nearly four months after the start of the Iran war, the US economy remains remarkably resilient. While the conflict initially triggered a severe disruption to global energy markets and a sharp rise in Oil prices, recent diplomatic progress between Washington and Tehran has eased concerns about a prolonged supply shock.

Regime change: Inside Kevin Warsh's first move to make the Fed unreadable on purpose

The rate did not move. That was the least interesting thing about Kevin Warsh's first meeting in charge of the Fed. The FOMC held its benchmark at 3.50%-3.75% for the fourth straight meeting, exactly as priced, and then the new chair used his first press conference to dismantle the machinery the market has leaned on for a decade.