|

NZD/JPY Price Analysis: Bears hold the upperhand, bearish SMA crossover might intensify momentum

  • The RSI on the daily chart lies deep in negative terrain.
  • Inidicators on the hourly chart are showing a slight improvement.
  • The 20 and 100-day SMAs are about to complete a bearish crossover around 91.00.

In Tuesday's session, the NZD/JPY pair is trading with a slight rise to 90.42, marking a 0.16% gain. Despite this, sellers retain dominance within the broader market scenario, hinting towards an entrenched bearish sentiment. Encouragingly though, hourly data suggests the potential for short-term bullish corrections, indicating a touch of buyer resilience.

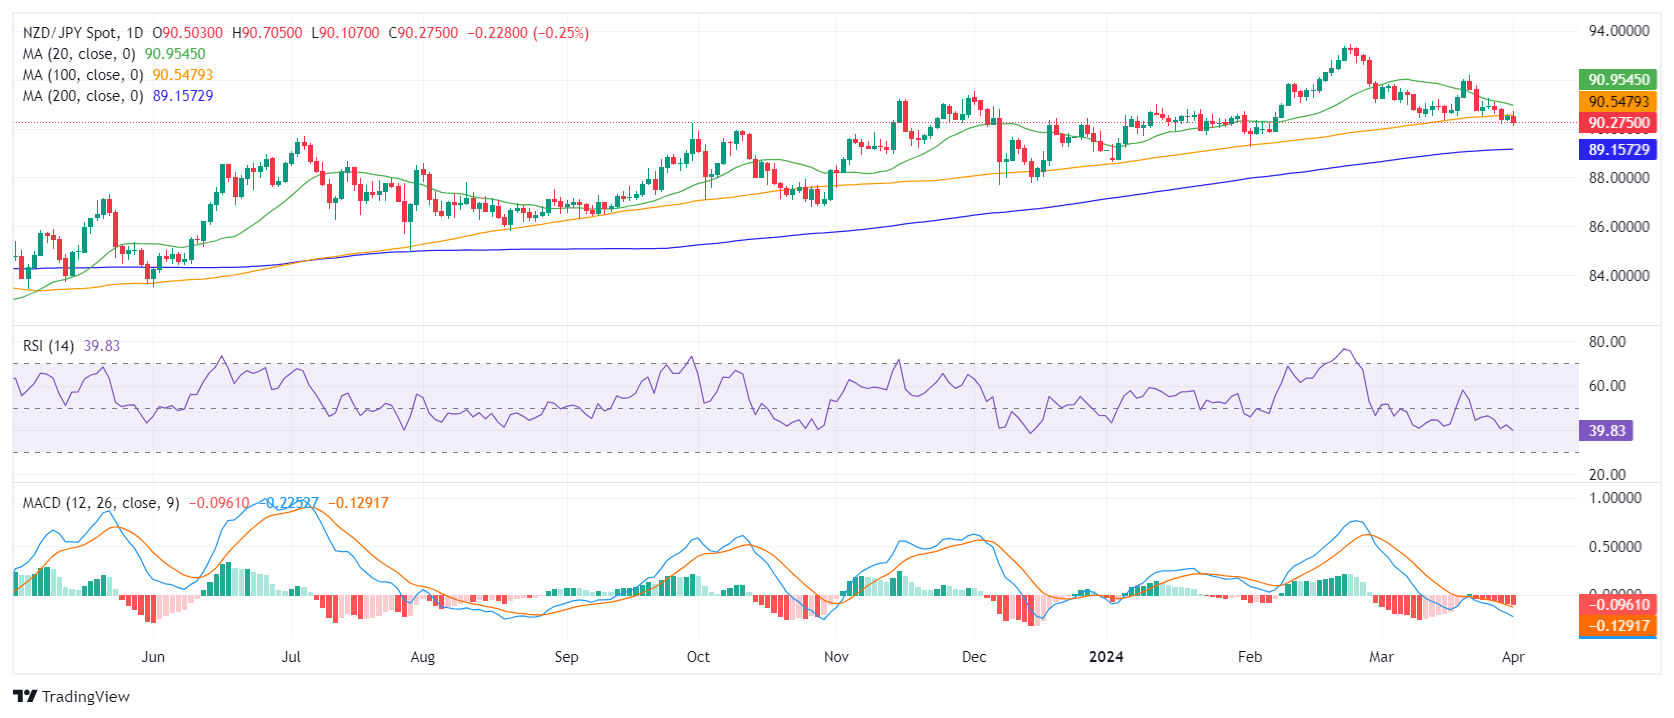
On the daily chart, the Relative Strength Index (RSI) shows a predominantly negative trend, remaining in the negative territory in the last sessions. Concurrently, the Moving Average Convergence Divergence (MACD) histogram reveals rising red bars, indicating a rising negative momentum.

NZD/JPY daily chart

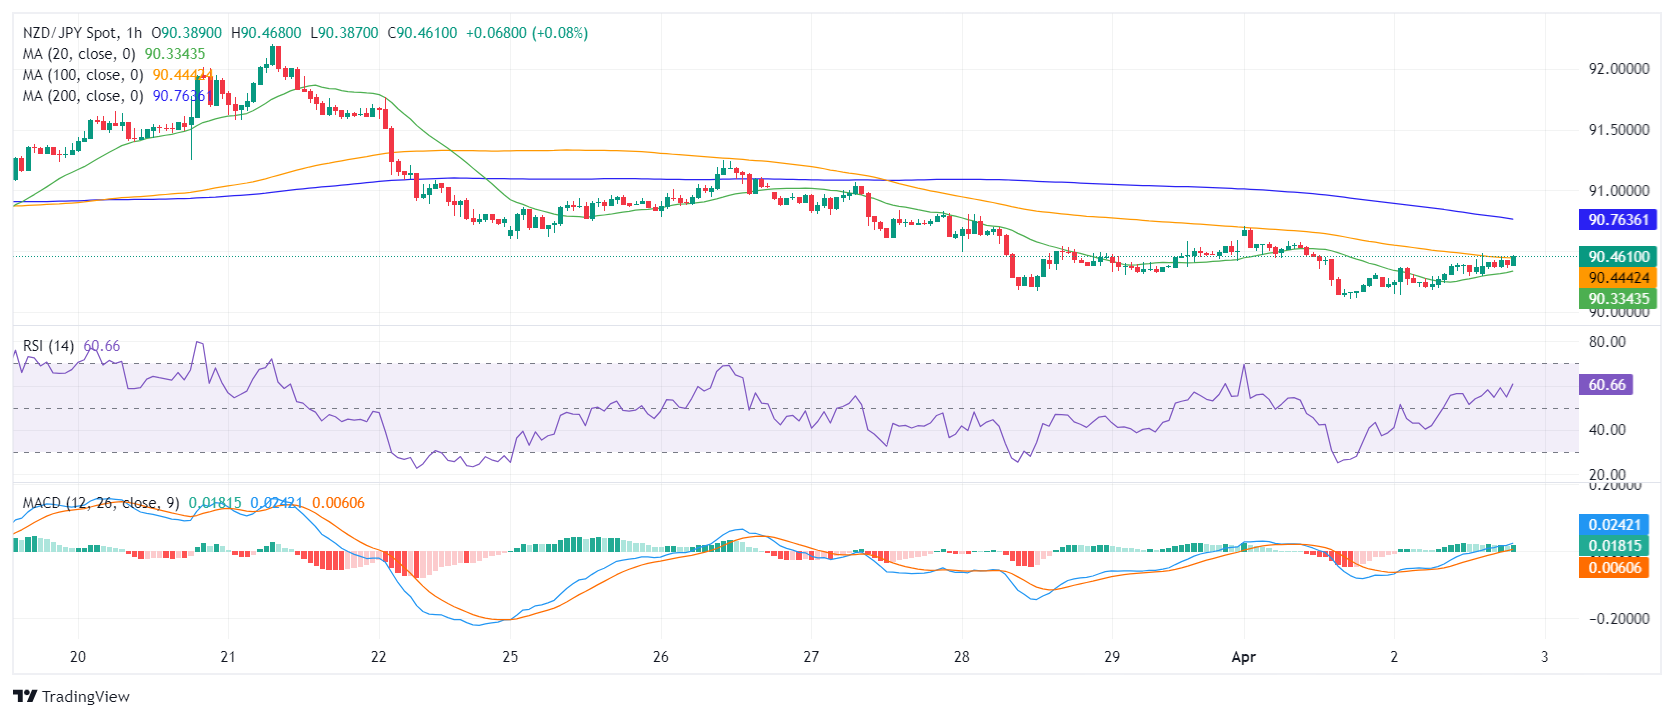
Moving on to the hourly chart, RSI values are inclining more towards the positive side, with the recent readings registered at 53. This shift may hint at a short-term gain in buyers' momentum. In addition, the hourly MACD histogram displays green bars, adding arguments for the recovering bullish momentum.

NZD/JPY hourly chart

Upon examining the broader perspective, the NZD/JPY has showcased significant bearish tendencies as its sits below its 20, 100 and 200-day Simple Moving Averages (SMA). In addition, a bearish crossover of the 20 and 100-day SMA at around 91.00 could precipitate even sharper declines.

Summarizing, sellers seem to have control over the NZD/JPY pair's direction on the daily chart. However, recent hourly data indicates potential short-term bullish corrections. Nevertheless, the prevailing trend is inclined towards further weakness, reinforced by the SMA positioning, and a potential bearish crossover.

NZD/JPY

Overview
Today last price90.44
Today Daily Change0.16
Today Daily Change %0.18
Today daily open90.28
 
Trends
Daily SMA2090.95
Daily SMA5091.17
Daily SMA10090.55
Daily SMA20089.16
 
Levels
Previous Daily High90.7
Previous Daily Low90.11
Previous Weekly High91.25
Previous Weekly Low90.17
Previous Monthly High92.2
Previous Monthly Low90.17
Daily Fibonacci 38.2%90.34
Daily Fibonacci 61.8%90.48
Daily Pivot Point S190.02
Daily Pivot Point S289.76
Daily Pivot Point S389.42
Daily Pivot Point R190.62
Daily Pivot Point R290.96
Daily Pivot Point R391.22

Author

Patricio Martín

Patricio is an economist from Argentina passionate about global finance and understanding the daily movements of the markets.

More from Patricio Martín
Share:

Markets move fast. We move first.

Orange Juice Newsletter brings you expert driven insights - not headlines. Every day on your inbox.

By subscribing you agree to our Terms and conditions.

Editor's Picks

EUR/USD extends gains toward 1.1700, eyes US PCE for fresh impetus

EUR/USD extends gains toward 1.1700 in European trading on Friday, revisiting seven-week highs. The pair continues to benefit from persistent US Dollar selling bias, despite a cautious market mood. Traders await the US September PCE inflation and UoM Consumer Sentiment data for fresh impetus. 

GBP/USD holds gains near 1.3350 ahead of US data

GBP/USD sticks to a positive bias near 1.3350 in the European session on Friday. Traders prefer to wait on the sidelines ahead of the key US inflation and sentiment data due later in the day. In the meantime, broad-based US Dollar weakness keeps the pair underpinned. 

Gold holds firm below $4,250, awaits US PCE inflation data

Gold holds gains while below $4,250 in European trading on Friday. Traders now seem reluctant and opt to move to the sidelines ahead of the September PCE Price Index, the Federal Reserve's preferred inflation gauge. 

Pi Network: Bearish streak nears critical support trendline

Pi Network edges lower on Friday for the third consecutive day, approaching a local support trendline. The on-chain data suggests an increase in supply pressure as Centralized Exchanges experience a surge in inflows. Technically, the pullback in PI risks further losses, as the Moving Average Convergence Divergence indicator is flashing a sell signal. 

Canada Unemployment Rate expected to edge higher in November ahead of BoC rate decision

Statistics Canada will release its Labour Force Survey on Friday, and markets are bracing for a weak print. The Unemployment Rate is expected to tick higher to 7% in November, while the Employment Change is forecast to come in flat after a nice gain in October.

Pi Network Price Forecast: Bearish streak nears critical support trendline

Pi Network (PI) edges lower on Friday for the third consecutive day, approaching a local support trendline. The on-chain data suggests an increase in supply pressure as Centralized Exchanges (CEXs) experience a surge in inflows.