Nifty Elliott Wave: Calling for a rally after corrective pullback

In this technical block, we’re going to take a quick look at the Elliott Wave charts of NIFTY Index published in members area of the website.
Recently, NIFTY completed a 3-wave corrective pullback following a 5-wave impulsive rally, creating a classic Elliott Wave bullish sequence. The index unfolded a clear 3-wave move lower from the peak and reached the Equal Legs zone, a key area where buyers were expected to step in. In the following analysis, we will examine the Elliott Wave structure in detail and discuss the potential market outlook from this support zone.
NIFTY Elliott Wave one-hour chart 07.23.2026
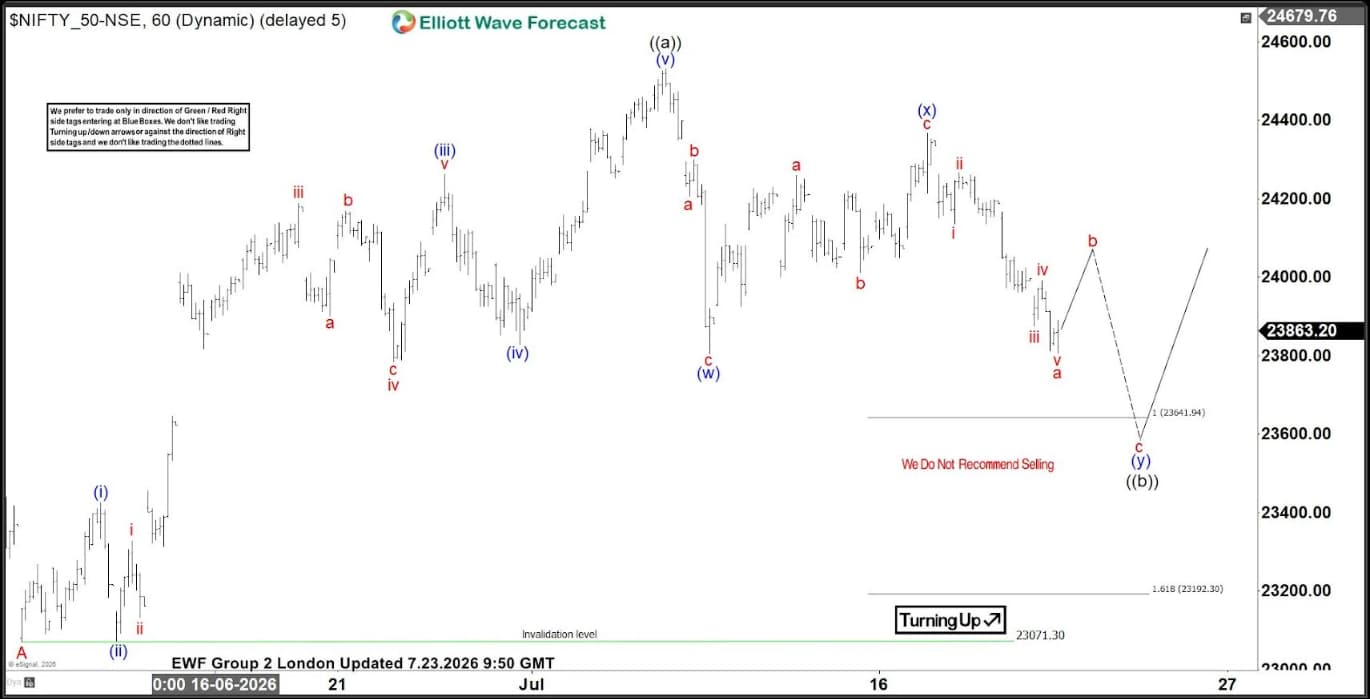
NIFTY is currently forming an intraday 3-wave pullback from the recent highs. Correction looks incomplete at the moment. The price structure is looking for another wave down. As our members know, the buying zone is derived by measuring the Equal Legs area using the Fibonacci extension tool. The ideal support zone comes in at 23641.9-23192.3. From this area, we expect buyers to step in and regain control, potentially driving price higher toward new highs.
Author

Elliott Wave Forecast Team
ElliottWave-Forecast.com