New Zealand Dollar heads for 3% weekly loss as robust US payrolls data lifts US Dollar
- NZD/USD heads for a weekly loss of nearly 3% after upbeat US payrolls data.
- The US Dollar Index climbs to its highest level since April.
- China's CPI, PPI and Trade Balance data will be closely watched next week.

NZD/USD slips to its lowest level since April on Friday as the US Dollar (USD) receives fresh bids in the wake of solid US Nonfarm Payrolls (NFP) data. At the time of writing, the pair trades around 0.5800 and is heading for a weekly loss of nearly 3%.
The US economy added 172K jobs in May, well above market expectations of 85K. April's payroll figures were revised higher to 179K from 115K, while the Unemployment Rate held steady at 4.3%.
Following the data, the US Dollar climbed to a two-month high as stronger-than-expected labor market data reinforced expectations that the Federal Reserve (Fed) can afford to keep interest rates unchanged amid heightened inflation risks stemming from higher Oil prices.
The US Dollar Index (DXY), which tracks the Greenback's value against a basket of six major currencies, trades around the 100.00 mark, up 0.64% on the day.
However, traders see a growing chance that the Fed could raise rates later this year. According to the CME FedWatch Tool, the probability of a 25-basis-point (bps) rate hike at the October meeting rose to 40% from 30% before the NFP report.
Looking ahead, New Zealand's economic calendar remains relatively empty next week, leaving traders focused on key US inflation data, including the Consumer Price Index (CPI) and Producer Price Index (PPI).
China's CPI, PPI and Trade Balance figures will also be closely watched, given New Zealand's strong trade ties with China and their potential impact on NZD/USD.
Technical Analysis:
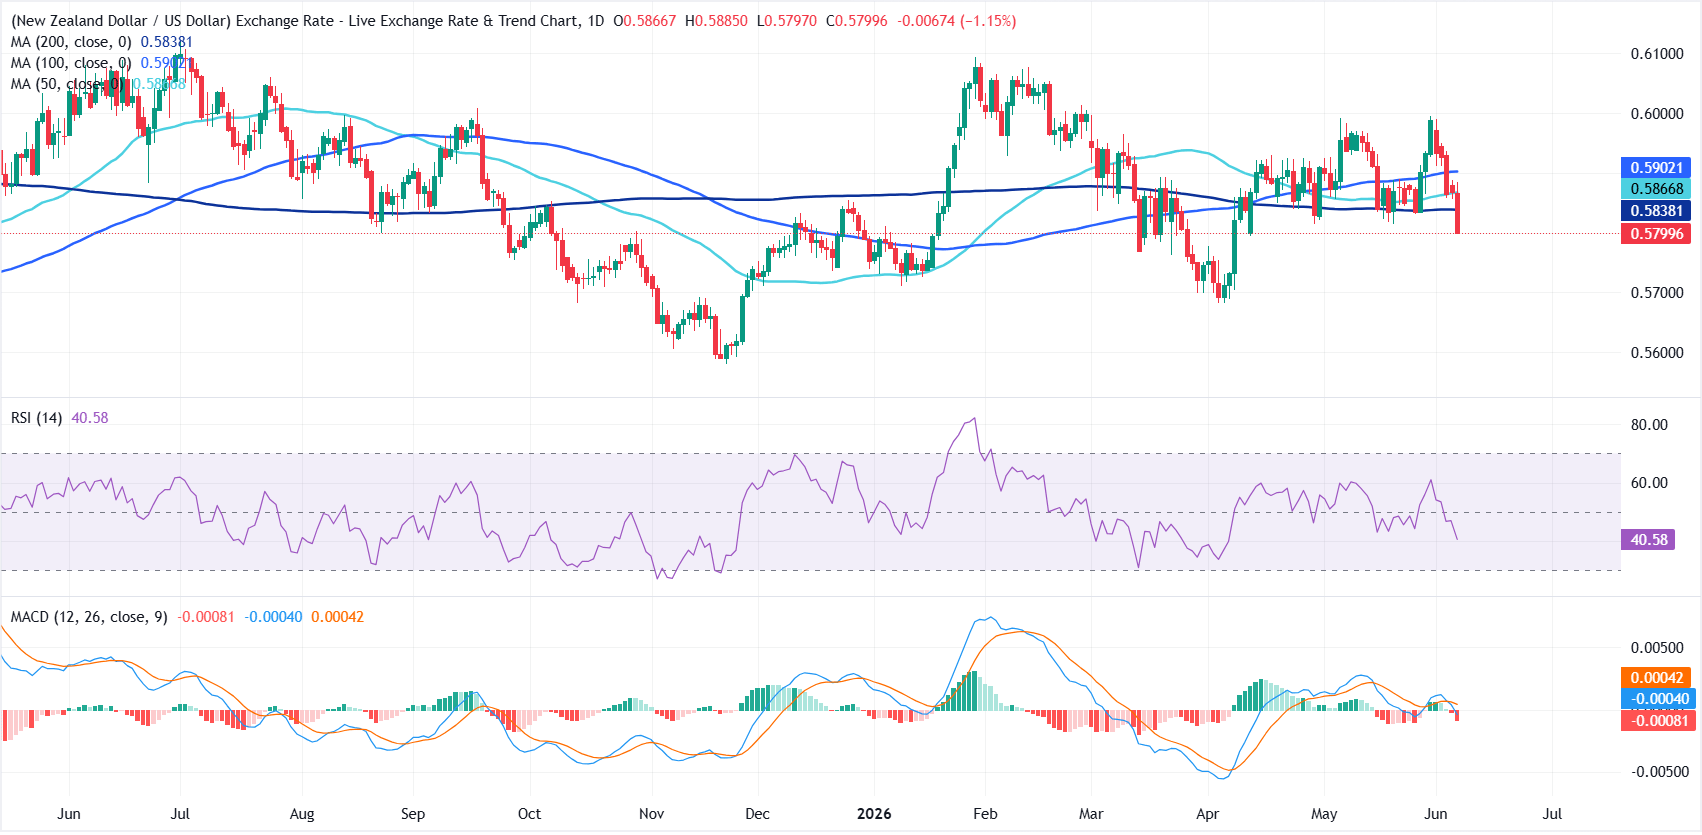
In the daily chart, NZD/USD trades at 0.5800. The pair holds a bearish near-term bias, as spot now sits below the 50-, 100-, and 200-day Simple Moving Averages (SMAs), which all hover overhead and reinforce a heavy tone. Momentum indicators align with this stance, with the Relative Strength Index drifting near 41 and the Moving Average Convergence Divergence (MACD) back in negative territory, hinting that downside pressure remains in play.
On the topside, initial resistance is seen at the 200-day SMA around 0.5838, with the 50-day SMA near 0.5867 and the 100-day SMA close to 0.5902 forming a broader resistance band that would need to be reclaimed to ease the current bearish pressure. With no clear technical support levels derived from moving averages or Fibonacci retracements just below the market in this dataset, any further losses would likely expose prior price lows as the next reference points for sellers.
(The technical analysis of this story was written with the help of an AI tool.)
Inflation FAQs
Inflation measures the rise in the price of a representative basket of goods and services. Headline inflation is usually expressed as a percentage change on a month-on-month (MoM) and year-on-year (YoY) basis. Core inflation excludes more volatile elements such as food and fuel which can fluctuate because of geopolitical and seasonal factors. Core inflation is the figure economists focus on and is the level targeted by central banks, which are mandated to keep inflation at a manageable level, usually around 2%.
The Consumer Price Index (CPI) measures the change in prices of a basket of goods and services over a period of time. It is usually expressed as a percentage change on a month-on-month (MoM) and year-on-year (YoY) basis. Core CPI is the figure targeted by central banks as it excludes volatile food and fuel inputs. When Core CPI rises above 2% it usually results in higher interest rates and vice versa when it falls below 2%. Since higher interest rates are positive for a currency, higher inflation usually results in a stronger currency. The opposite is true when inflation falls.
Although it may seem counter-intuitive, high inflation in a country pushes up the value of its currency and vice versa for lower inflation. This is because the central bank will normally raise interest rates to combat the higher inflation, which attract more global capital inflows from investors looking for a lucrative place to park their money.
Formerly, Gold was the asset investors turned to in times of high inflation because it preserved its value, and whilst investors will often still buy Gold for its safe-haven properties in times of extreme market turmoil, this is not the case most of the time. This is because when inflation is high, central banks will put up interest rates to combat it. Higher interest rates are negative for Gold because they increase the opportunity-cost of holding Gold vis-a-vis an interest-bearing asset or placing the money in a cash deposit account. On the flipside, lower inflation tends to be positive for Gold as it brings interest rates down, making the bright metal a more viable investment alternative.
Author

Vishal Chaturvedi
FXStreet
I am a macro-focused research analyst with over four years of experience covering forex and commodities market. I enjoy breaking down complex economic trends and turning them into clear, actionable insights that help traders stay ahead of the curve.


