Nasdaq, SMH: Have we found a major top on the AI trade?
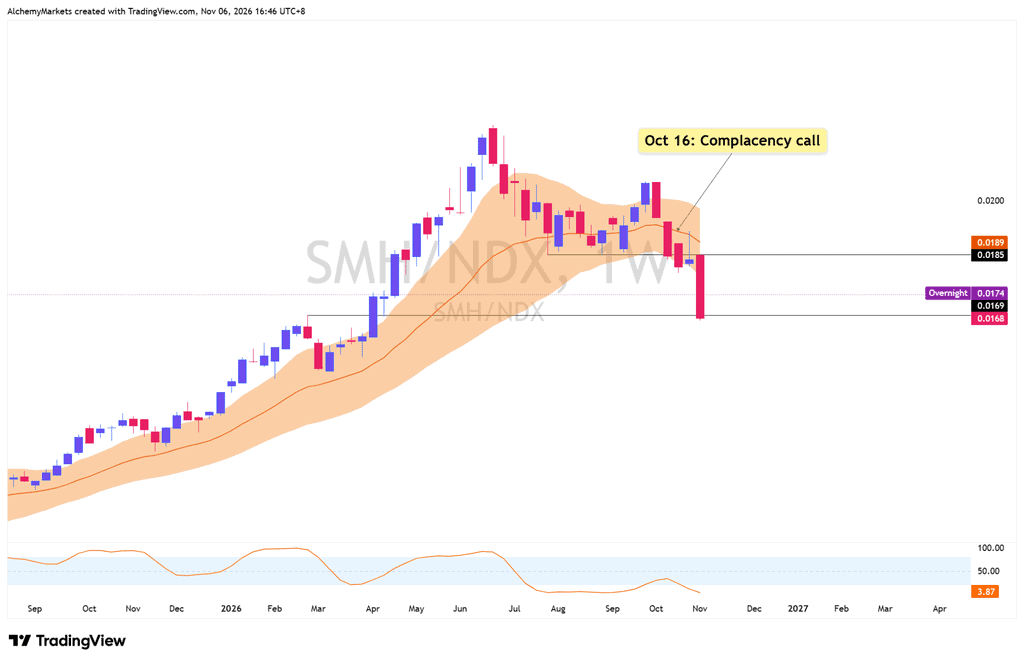
About a month ago, we released a view on the markets being complacent when the SMH ETF was creating what looked like an inverse cup and handle against the Nasdaq chart.
It’s been 3 weeks, and since then SMH has formed a new low and lost its 20 week-EMA (1sd) against the Nasdaq; adding some validity to the view that a major top could be in.
The signs have become increasingly difficult to ignore.
On November 4th, the S&P 500 rallied 1.6% while SMH fell 2.75%.
Then yesterday, on November 5th, the Nasdaq plunged 5.5% into correction territory, while the Philadelphia Semiconductor Index (SOX) suffered a 12.2% decline.
On the raw chart itself, traders have begun to notice the similarities to the Wall Street cheat sheet as well.
Interestingly, Elliott Investment Management, the roughly $80 billion hedge fund, had already sounded the alarm in an October investor letter, warning that nearly every major indicator of an approaching bear market was flashing red.
The fund pointed towards excessive speculation, mounting debt, AI-related valuations and the risk of a self-reinforcing market unwind. It even warned that investors’ FOMO (fear of missing out) could turn into FOGO: fear of getting obliterated.
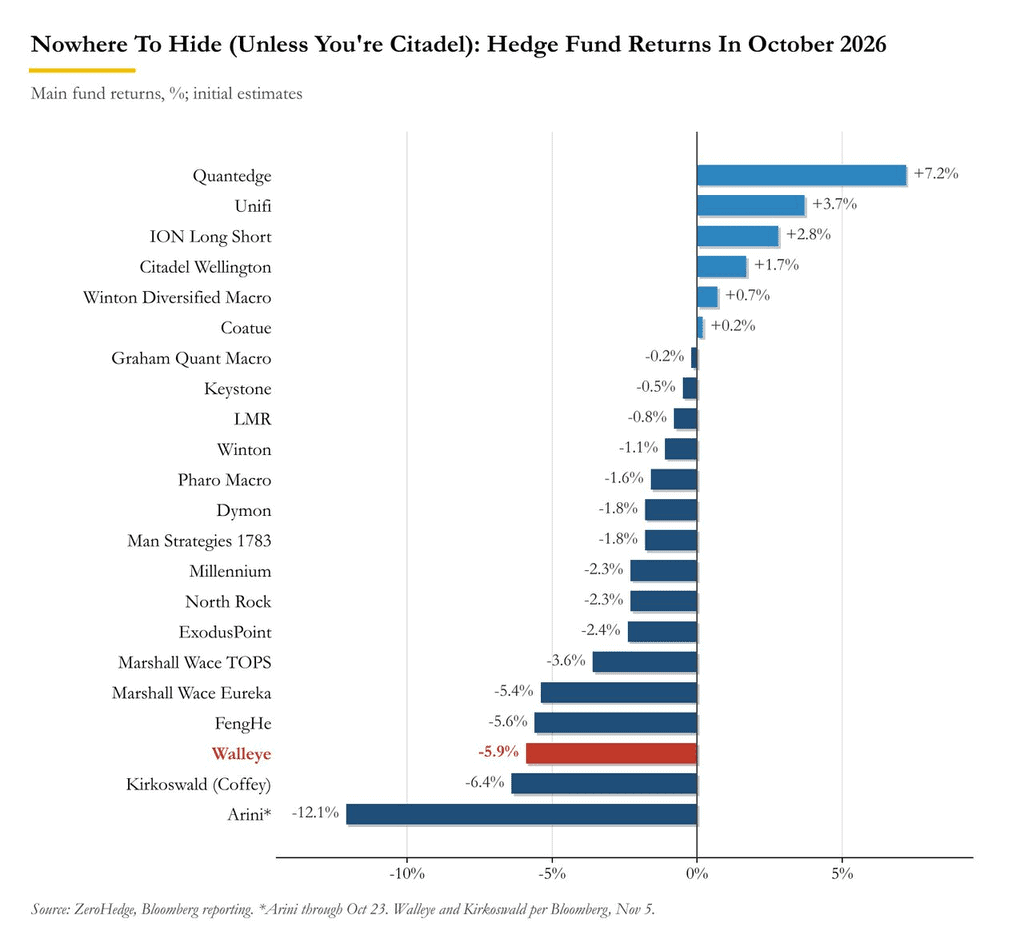
Several large multi-manager hedge funds are reported to be reducing leverage and cutting underperforming teams.
Walleye Capital, a $17 billion fund, even announced plans to return some investor capital following its worst month since March 2020.
Well. Here we are today.
Many traders, including myself, have been wondering just what triggered the sell-off yesterday.
According to Goldman Sachs, technology-focused equity hedge funds lost more than 4% on November 5 alone, leaving their year-to-date returns roughly flat, compared with peak gains of 24% in June.
The problem is that many funds are holding increasingly similar positions. As these positions decline, leveraged investors may be forced to liquidate their holdings to meet margin requirements or reduce portfolio risk. This creates additional selling pressure, potentially triggering the same response from other investors.
As a result, sympathy sell-offs are channelling through Bitcoin and large caps (like the MAG7) as traders reduce leveraged long positions. Gold, however, has held up better during the latest equity rout, suggesting that some investors are still seeking traditional safe havens.
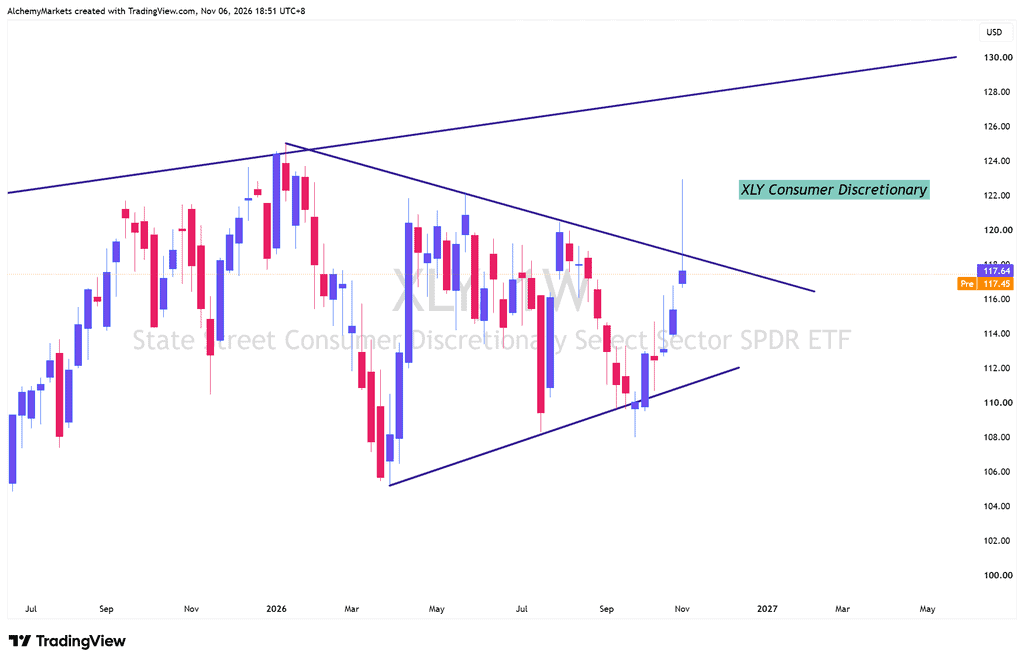
More interestingly, non-AI heavy ETFs like the XLY are also being hit; much thanks of its 40% weighting of Tesla and Amazon.
After what looked like what could be an interesting sector rotation into consumer discretionary stocks, the XLY index lost most of its weekly gains after touching the top of its weekly triangle pattern.
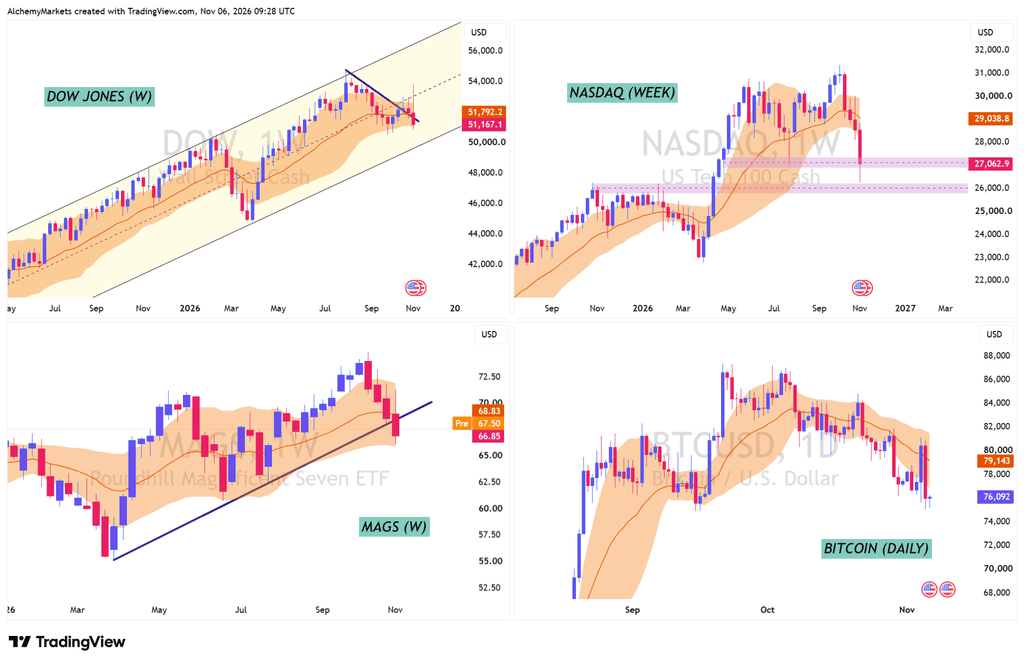
Dow as well, while staging what looked like a breakout and resilience against the AI trade, has also given up most of its gains (and then some) this week – after touching the midline of its broader rising channel.
MAGS broke its weekly rising trendline and Nasdaq-100 has also fallen below its 20 week EMA bollinger band (1sd), and Bitcoin is also below its daily 20-period EMA band.
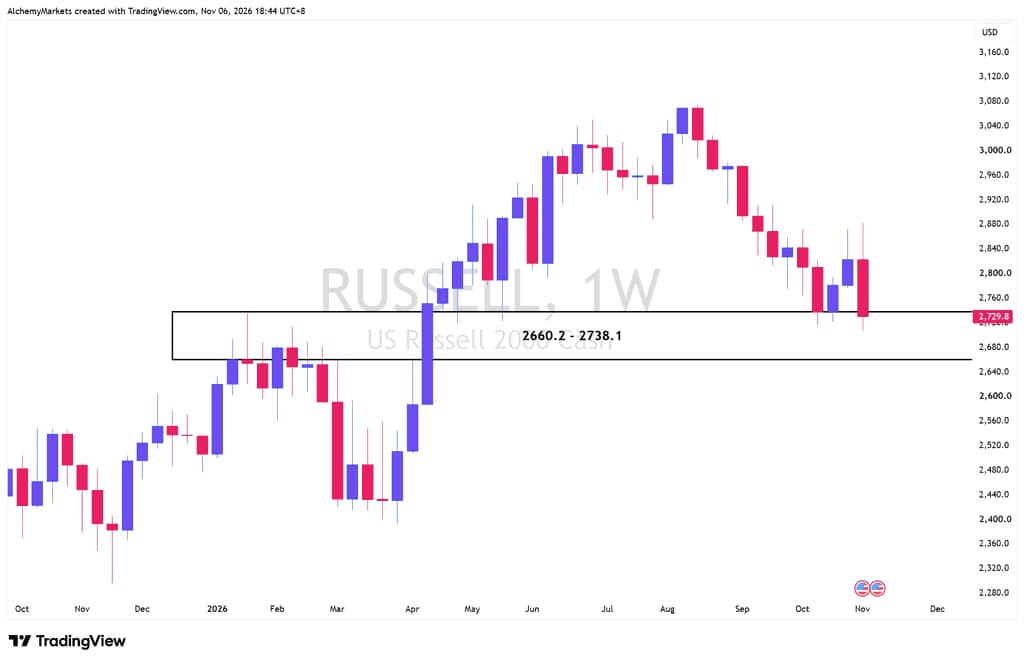
Even the Russell 2000, comprising of mostly small caps, was hit hard, with it now sitting on top of a weekly support level. So this sell-off is looking less like a sector-rotation and more like market wide contagion.
Of course, forced liquidation may not be the only catalyst behind the decline.
Investors are also becoming increasingly concerned about the sustainability of the AI investment boom, particularly the enormous capital expenditure commitments, rising financing costs and uncertainty surrounding future returns.
The recent Democratic midterm victories have added another layer of uncertainty, with investors questioning whether tighter restrictions on data-centre development could slow infrastructure spending and, consequently, demand for semiconductors.
If the Wall Street Cheat Sheet’s complacency analogy holds, a recovery from here could be brief before another leg lower. That remains a scenario to be seen and not a definitive outcome at this stage.
The question now is whether this is simply a violent positioning reset, or the beginning of a more fundamental repricing of the AI trade.
Bottom line
For now, the SMH/Nasdaq relative-strength chart remains an important indicator to watch. A recovery above the broken weekly EMA band could suggest that the recent breakdown was temporary.
Continued weakness, however, would add further weight to the possibility that semiconductor stocks have already signalled a major market top.
Author

Zorrays Junaid
Alchemy Markets
Zorrays Junaid has extensive combined experience in the financial markets as a portfolio manager and trading coach. More recently, he is an Analyst with Alchemy Markets, and has contributed to DailyFX and Elliott Wave Forecast in the past.