|

Nasdaq Elliott Wave: Climbing the 5th wave

Executive summary

  • Trend Bias: Wave v of (v) rally.
  • Key Support Level: 30.092.
  • If correct, wave v could carry up to 31,388 – 31,579.

For the past 3 months, Nasdaq has essentially marched higher with only a few breaks. Yesterday, a trend line was broken alerting us to a tired uptrend. Though higher prices are possible, divergence and broken trend lines imply a correction may be looming around the corner.

Current Elliott Wave analysis

Chart

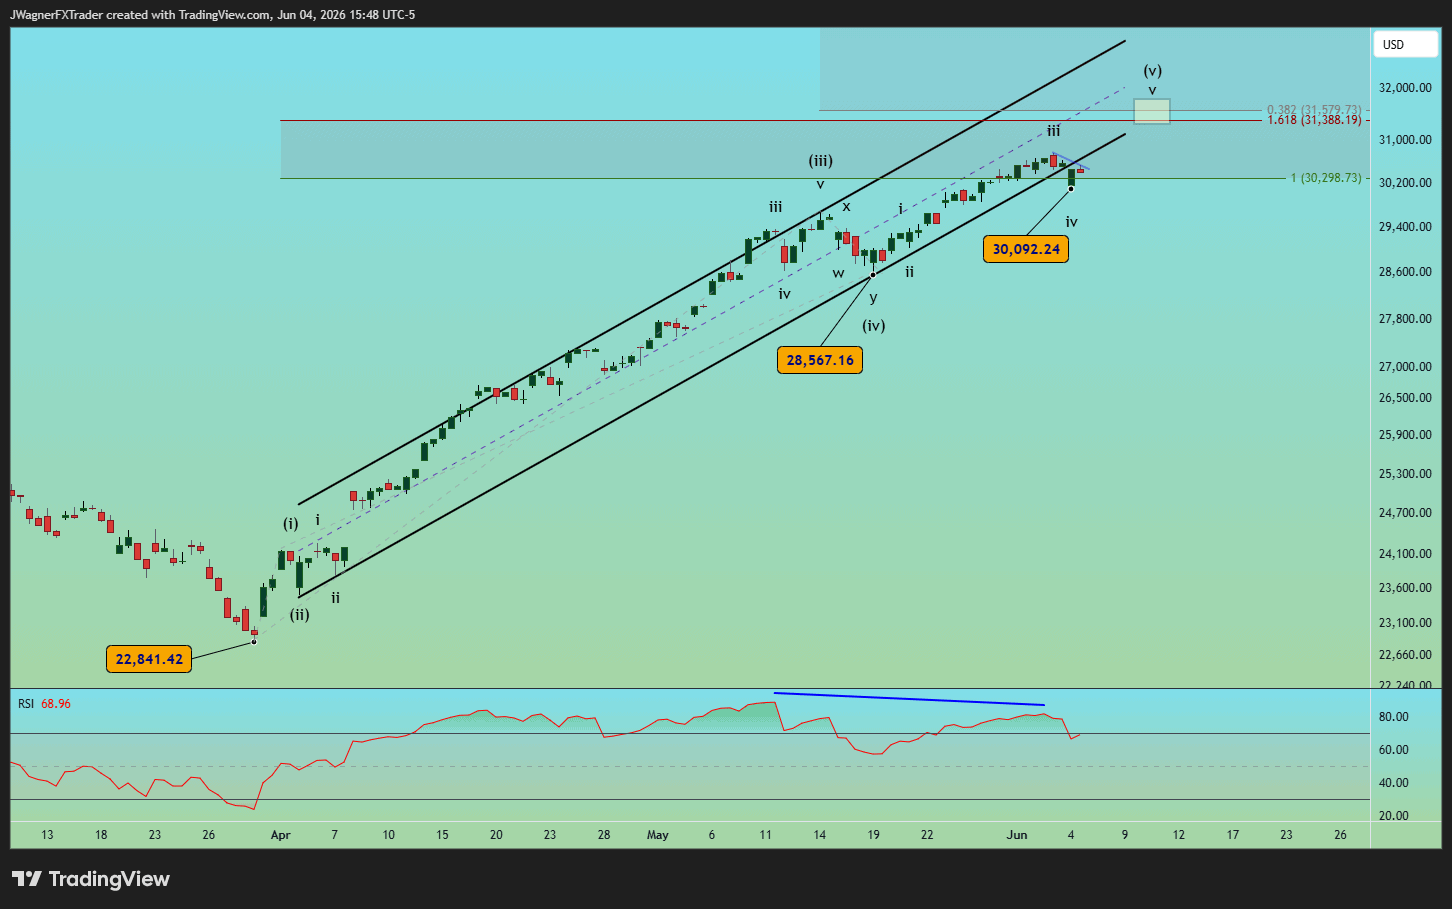
Our Elliott wave analysis of the Nasdaq 100 (NDX) chart shows the rally from the March 2026 low to now is shaping an Elliott wave impulse pattern. 

Impulses include 5-subwaves, in this case labeled (i)-(ii)-(iii)-(iv)-(v).

It appears Nasdaq is in the final wave of the sequence, wave (v). 5th waves also subdivide into 5-waves and this week’s low appears to be a 4th wave. This means the larger wave count is that yesterday’s rally kicked off wave v of (v)…an ending wave at multiple degrees of trend.

There are a couple of wave relationships we are following that may point to a hesitation in price.

Wave (v) would be the 1.618 Fibonacci extension of wave (i) at 31,388.

Additionally, wave (v) is the 38% Fibonacci extension of waves (i)-(iii) at 31,579.

Therefore, this price zone between 31,388 – 31,579 may create some hesitation in prices.

If prices fall below 30,092, it’ll be an early warning signal that a larger setback is underway. If 28,567 horizontal support is broken, then it would signal a more significant top has shaped.

Bottom line

The structure of the rally from March is a mature impulse pattern. Further upside may be available to 31,388 – 31,579, but prices appear to be in an ending wave at multiple degrees of trend.

If 30,092 breaks, then a larger setback may lead to more losses.

Author

Zorrays Junaid

Zorrays Junaid

Alchemy Markets

Zorrays Junaid has extensive combined experience in the financial markets as a portfolio manager and trading coach. More recently, he is an Analyst with Alchemy Markets, and has contributed to DailyFX and Elliott Wave Forecast in the past.

More from Zorrays Junaid
Share:

Editor's Picks

AUD/USD falls to near 0.7100 after slipping below 50-day EMA

AUD/USD depreciates after registering minor gains in the previous day, trading around 0.7120 during the Asian hours. The technical analysis of the daily chart shows the pair consolidating sideways within a rectangle pattern, as neither bulls nor bears gain control. The AUD/USD pair is holding a slight bearish tone however as it sits beneath both the nine-day and 50-day EMAs.

Japanese Yen edges up but remains close to the 160.00 intervention threshold

The Japanese Yen edges up against the US Dollar on Friday, but the USD/JPY pair remains above 159.90 at the time of writing, unable to put a significant distance from the 160.00 level, considered the limit of tolerable JPY weakness for Japanese authorities.

Gold returns to the red, awaits US NFP

Gold price is looking to test the weekly lows, while in the red near $4,450 in the early European session on Friday. The precious metal remains vulnerable amid ongoing geopolitical turmoil. Traders will closely monitor the developments surrounding the US-Iran peace deal and the US May employment report later on Friday.


Arthur Hayes' “Holy Trinity” is dead: Exits Zcash after Orchard Pool exploit

Arthur Hayes has entirely dumped his “Holy Trinity” holdings by offloading his Zcash holdings on Friday. The privacy coin is down 13% so far on Friday, extending Thursday’s 26% decline after an Orchard Shielded Pool audit revealed a critical vulnerability that allowed the undetectable minting of fake coins. Hayes continues to hold Worldcoin ahead of the upcoming SpaceX Initial Public Offering, on the chance of a “high-beta proxy” rally.

Nonfarm Payrolls set to show stable labor market in May as markets digest Fed hawkish shift

The United States Bureau of Labor Statistics will release the Nonfarm Payrolls data for May on Friday at 12:30 GMT. Investors expect NFP to rise by 85K following the surprisingly strong 185K and 115K increases recorded in March and April, respectively.

Recession on paper: What really moves the Canadian Loonie now?

Statistics Canada handed the headline writers a gift and the analysts a headache. Real GDP shrank 0.1% on an annualized basis in the first quarter, and with the fourth quarter of 2025 revised down to a 1.0% contraction, that is two negative quarters in a row, the textbook definition of a technical recession and Canada's first since the pandemic.