Bitcoin Price Forecast: BTC slips below $64,000 as risk-off sentiment grips markets
- Bitcoin extends its decline, slipping below $64,000 on Tuesday after correcting over 2.5% the previous day.
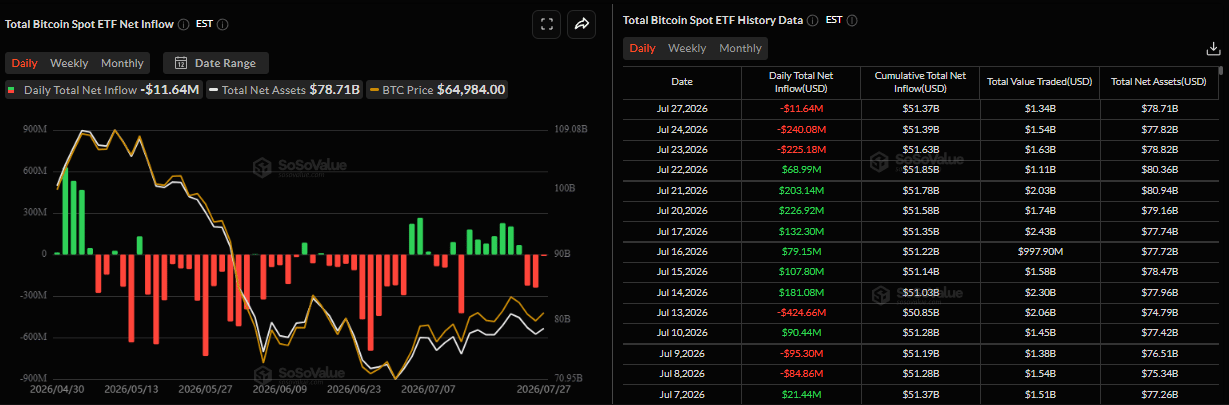
- US-listed spot ETFs recorded mild outflows on Monday, marking three consecutive days of withdrawals.
- Deteriorating global risk sentiment, fueled by an AI-led semiconductor sell-off, weighs on other risk assets including BTC.

Bitcoin (BTC) is extending its correction, trading below $64,000 at the time of writing on Tuesday after losses of over 2.5% the previous day. Institutional demand shows early signs of weakness, with spot Exchange Traded Funds (ETFs) recording a mild outflow on Monday, marking three consecutive days of withdrawals. In addition, deteriorating global risk sentiment, triggered by an AI-led semiconductor sell-off this week, is weighing on other risk assets such as BTC.
Risk-off sentiment from Asian markets weighs on crypto outlook
Global risk sentiment deteriorates on Tuesday as mounting skepticism about the massive financial returns from Artificial Intelligence (AI) spending triggers a widespread sell-off in global semiconductor shares. The tech-driven downturn ripples from Wall Street into Asian markets, while investors shift toward safety assets, driving bond prices higher.
While cryptocurrencies generally move in tandem with risk assets like tech stocks, the digital asset market has also corrected so far this week, with Bitcoin slipping below $64,000 on Tuesday.
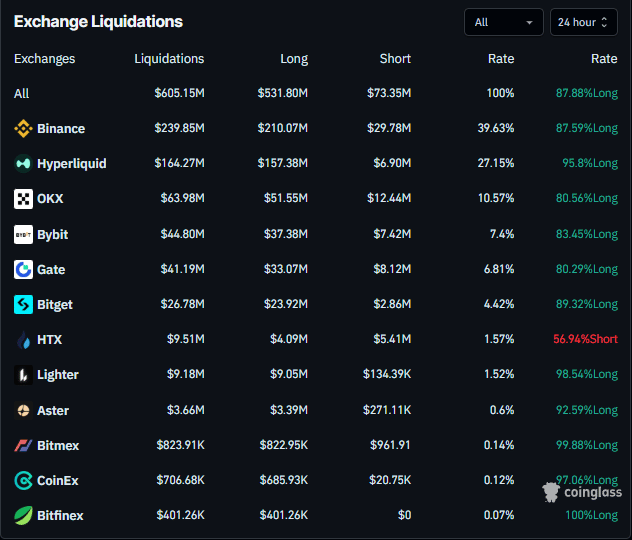
The overall risk-off environment also triggered a sharp wave of liquidations across the crypto market. The Coinglass chart below shows that more than $600 million in leveraged positions were wiped out over the past 24 hours, with 87.88% of positions being longs, highlighting the unwinding of bullish bets.
In an exclusive interview, Nicolai Sondergaard, Senior Research Analyst at Nansen, told FXStreet that the sharp sell-off in Asian and global semiconductor stocks reflected a broader deterioration in risk sentiment after reports suggested China had developed competitive domestic deep ultraviolet (DUV) lithography technology, challenging the long-standing dominance of Western suppliers such as ASML.
Sondergaard noted that the risk-off move spilled over into cryptocurrencies, as institutional investors reducing exposure to technology stocks typically do not ring-fence crypto allocations. As a result, Bitcoin fell alongside broader risk assets, slipping to around $63,100 during early Asian trading.
However, he emphasized that Bitcoin's weakness is also being driven by crypto-native headwinds. Stablecoin exchange inflow velocity had already fallen to an 18-month low of 21,557 transactions per day before this sell-off, down 56% from the range that sustained last year's rally. Spot Bitcoin ETFs snapped a seven-session inflow streak, and the long-term holder Spent Output Profit Ratio (SOPR) remained in capitulation territory rather than confirming a bottom.
“Nansen data shows spot taker buy ratios running 25 to 30 percentage points above perpetual taker ratios across all timeframes, meaning the derivatives selling is being absorbed by spot buyers. Distribution rather than panic, which keeps downside orderly but removes the conditions for recovery before this week's macro sequence resolves,” concluded Nicolai Sondergaard.
Institutional demand shows early signs of weakness
Institutional demand shows weakening signs. SoSoValue data shows that US-listed spot BTC ETFs recorded mild outflows of $11.64 million on Monday, marking three consecutive days of withdrawals. If these outflows continue and intensify through the week, BTC could extend its correction.
Bitcoin technical outlook: BTC slips below key supports
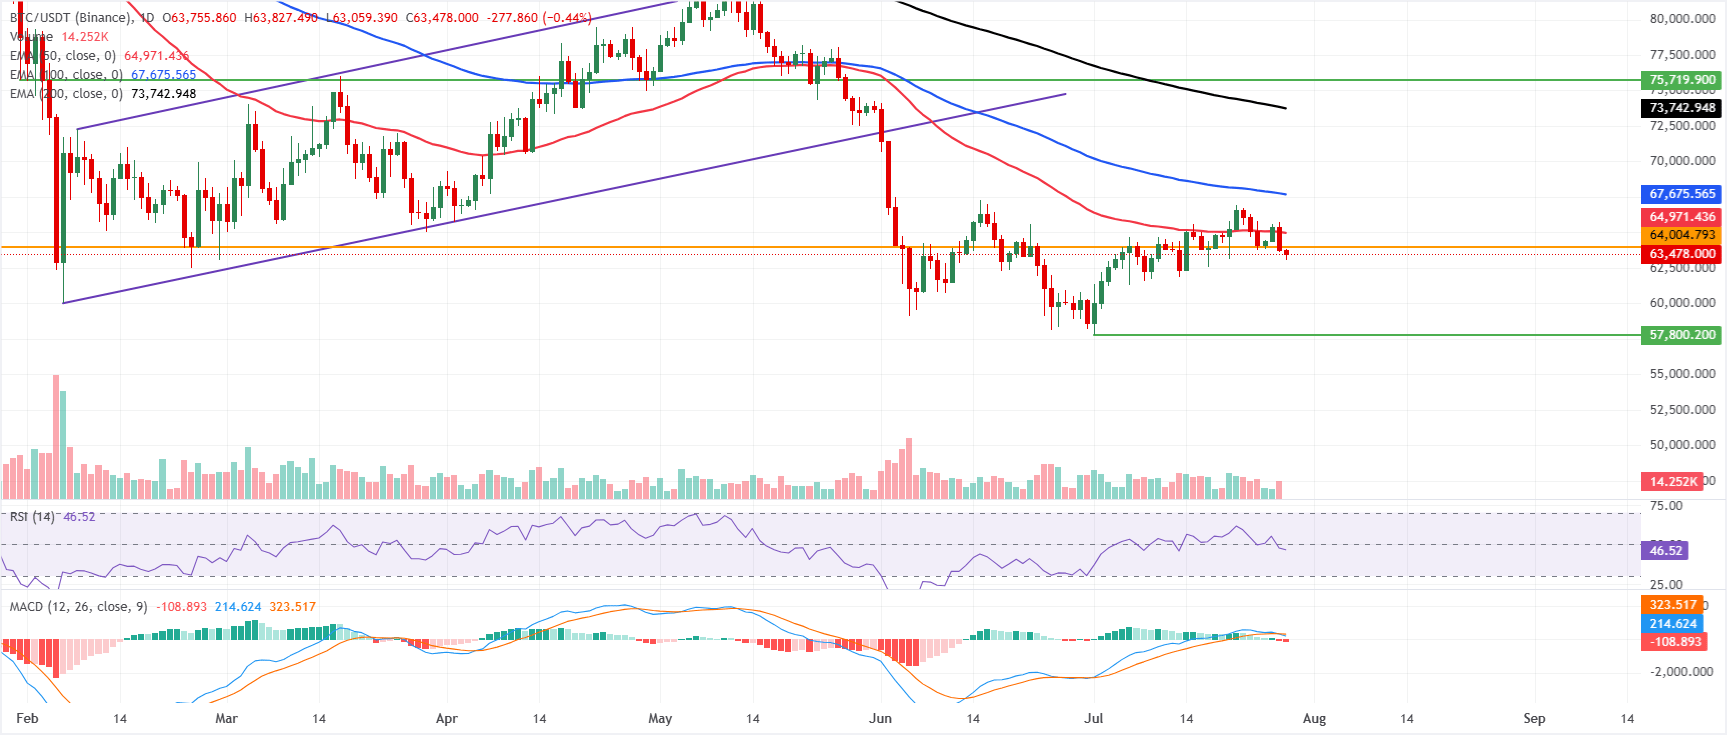
Bitcoin price trades at $63,478 at the time of writing on Tuesday, down slightly from the previous day's close. BTC is maintaining a bearish near-term bias as it remains below all key Exponential Moving Averages (EMAs). The 50-day EMA at $64,971, the 100-day EMA at $67,6765 and the 200-day EMA at $73,742 all sit overhead, suggesting rallies are likely to be sold while price remains capped below this stacked cluster of longer-term trend gauges.
Momentum also leans negative on the daily chart, with the Relative Strength Index (RSI) hovering just under the neutral 50 mark and the Moving Average Convergence Divergence (MACD) indicator in negative territory, hinting that recovery attempts could struggle to gain traction.
On the topside, initial resistance is seen at the horizontal barrier near $64,004, closely followed by the 50-day EMA at $64,972. A break above these levels would expose the next bullish objective at the 100-day EMA around $67,676, ahead of the more strategic 200-day EMA at $73,743. The distant horizontal resistance at $84,410 marks a major upside reference if buyers regain control.
On the downside, the lack of nearby supports leaves the current trading zone as an exposed foothold. If BTC continues its correction, it could extend toward the yearly low of $57,800, set on July 1.
(The technical analysis of this story was written with the help of an AI tool. Know more.)
Bitcoin, altcoins, stablecoins FAQs
Bitcoin is the largest cryptocurrency by market capitalization, a virtual currency designed to serve as money. This form of payment cannot be controlled by any one person, group, or entity, which eliminates the need for third-party participation during financial transactions.
Altcoins are any cryptocurrency apart from Bitcoin, but some also regard Ethereum as a non-altcoin because it is from these two cryptocurrencies that forking happens. If this is true, then Litecoin is the first altcoin, forked from the Bitcoin protocol and, therefore, an “improved” version of it.
Stablecoins are cryptocurrencies designed to have a stable price, with their value backed by a reserve of the asset it represents. To achieve this, the value of any one stablecoin is pegged to a commodity or financial instrument, such as the US Dollar (USD), with its supply regulated by an algorithm or demand. The main goal of stablecoins is to provide an on/off-ramp for investors willing to trade and invest in cryptocurrencies. Stablecoins also allow investors to store value since cryptocurrencies, in general, are subject to volatility.
Bitcoin dominance is the ratio of Bitcoin's market capitalization to the total market capitalization of all cryptocurrencies combined. It provides a clear picture of Bitcoin’s interest among investors. A high BTC dominance typically happens before and during a bull run, in which investors resort to investing in relatively stable and high market capitalization cryptocurrency like Bitcoin. A drop in BTC dominance usually means that investors are moving their capital and/or profits to altcoins in a quest for higher returns, which usually triggers an explosion of altcoin rallies.
Author

Manish Chhetri
FXStreet
Manish Chhetri is a crypto specialist with over four years of experience in the cryptocurrency industry.




