Momentum loses altitude, correlation waits to strike, and America’s wealth mirror cracks

Equity daily: SpaceX has become the poster child for a momentum trade losing altitude
Bloomberg macro strategist Simon White argues that SpaceX has gone from the hottest public-market launch in years to one of the clearest symbols of a momentum trade now losing altitude.
The opening burst was spectacular. SpaceX climbed almost 50% from its mid-June IPO price on a closing basis, outperforming every other major Nasdaq debut at a comparable point in its early trading history. Yet the enthusiasm did not merely cool. The shares subsequently slipped below their initial level and are now performing worse than almost 80% of similarly large Nasdaq IPOs at the same stage after listing.
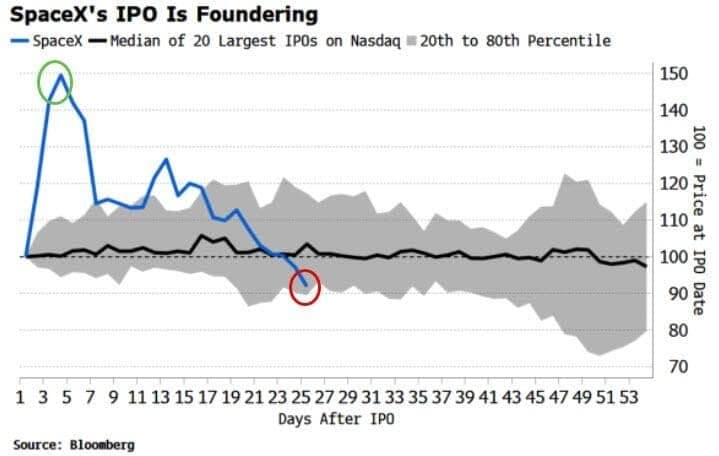
That reversal matters because the size of the initial surge left the stock perched on a very narrow ledge. SpaceX had risen further and faster than the overwhelming majority of comparable IPOs, creating the kind of crowded enthusiasm that requires a constant stream of fresh buyers to remain airborne. Once those buyers began to disappear, gravity returned quickly.
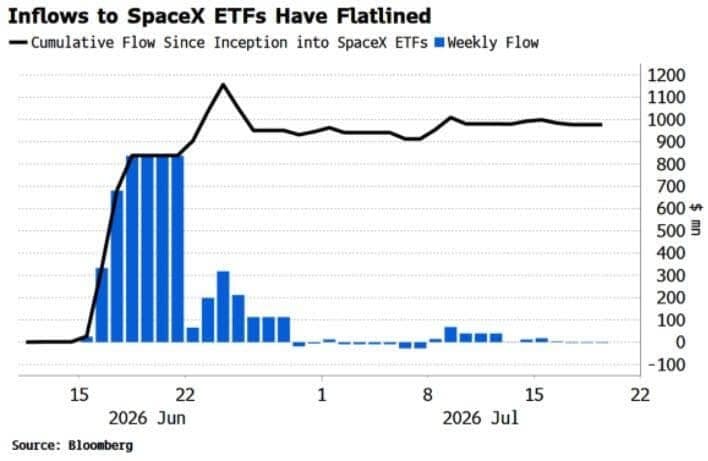
White points to ETF flows as one of the clearest signs that the launch fuel has been exhausted. Money poured into SpaceX-linked funds immediately after the IPO, but the rush faded almost as quickly as it began. Cumulative inflows have been stuck between $900 million and $1 billion since late June, suggesting the first wave of demand arrived in a single burst rather than through a sustained accumulation process.
This is where the SpaceX story begins to overlap with the broader market. White describes the stock as a leitmotif for the momentum trade, a highly visible expression of the same forces that previously drove investors into semiconductors and other recent winners. As momentum reverses, yesterday’s strongest performers are no longer rewarded simply for having gone up. They become natural funding sources and, eventually, potential short candidates as systematic strategies begin to chase the move in the opposite direction.
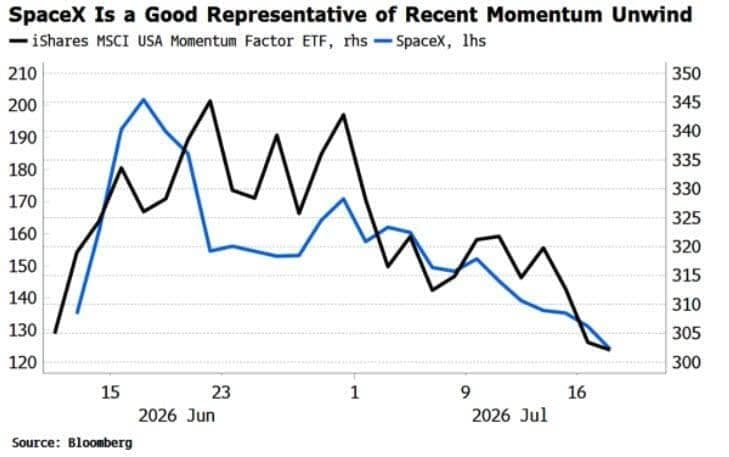
The resemblance is already visible. The iShares MSCI USA Momentum Factor ETF has tracked SpaceX remarkably closely since the company went public. Both surged, stalled and then rolled over as the market’s appetite for expensive winners began to fade.
Before the IPO, some investors suggested that the SpaceX listing might mark the high-water mark of speculative enthusiasm. It is still too early to declare that the IPO marked the top of the broader market, but White notes that equities have largely moved sideways since the IPO. That does not prove the bull market is over, though it does suggest the listing arrived as the market’s engines were already sputtering.
The more important problem is that financial conditions have tightened while liquidity has become less forgiving. When money is abundant, valuation gaps can remain open for far longer than fundamentals might justify. Once liquidity contracts, however, the market begins inspecting every passenger ticket. Stocks that rose primarily because investors feared missing the launch are usually the first to be asked whether they can justify the altitude.
White’s framework points toward a broader 10% to 15% correction as the excess is cleared from the system. That would be painful, particularly for the most crowded momentum names, but it would not automatically imply a deeper economic fracture. As long as recession risk remains contained, the more likely outcome is a difficult market reset rather than a full-blown collapse.
SpaceX may therefore be less important as an individual stock than as a market signal. Its rise captured the final rush of enthusiasm. Its fall is showing what happens when the buyers stop arriving and the momentum machine begins running in reverse.
Derivatives daily: When every stock is its own storm, funds start betting the index will eventually catch the weather
Bloomberg’s Bernard Goyder, Felice Maranz and Christian Dass examine a volatility trade that is beginning to turn back on itself. For much of the past year, hedge funds have profited from buying volatility in individual stocks while selling volatility in the S&P 500, effectively betting that the components would buck and kick while the index remained relatively calm. That trade has worked so well that parts of the market are now starting to wonder whether it has become a victim of its own success.
Expected dispersion among large-cap US stocks has climbed to its highest level since 2020, while implied correlation among the S&P 500’s largest constituents has fallen close to record lows. Earnings season naturally creates separation as companies deliver different results, guidance and outlooks, but the current gap has moved well beyond the usual quarterly noise. Individual stocks are being priced for violent moves even as the index is treated as though it is sitting behind soundproof glass.
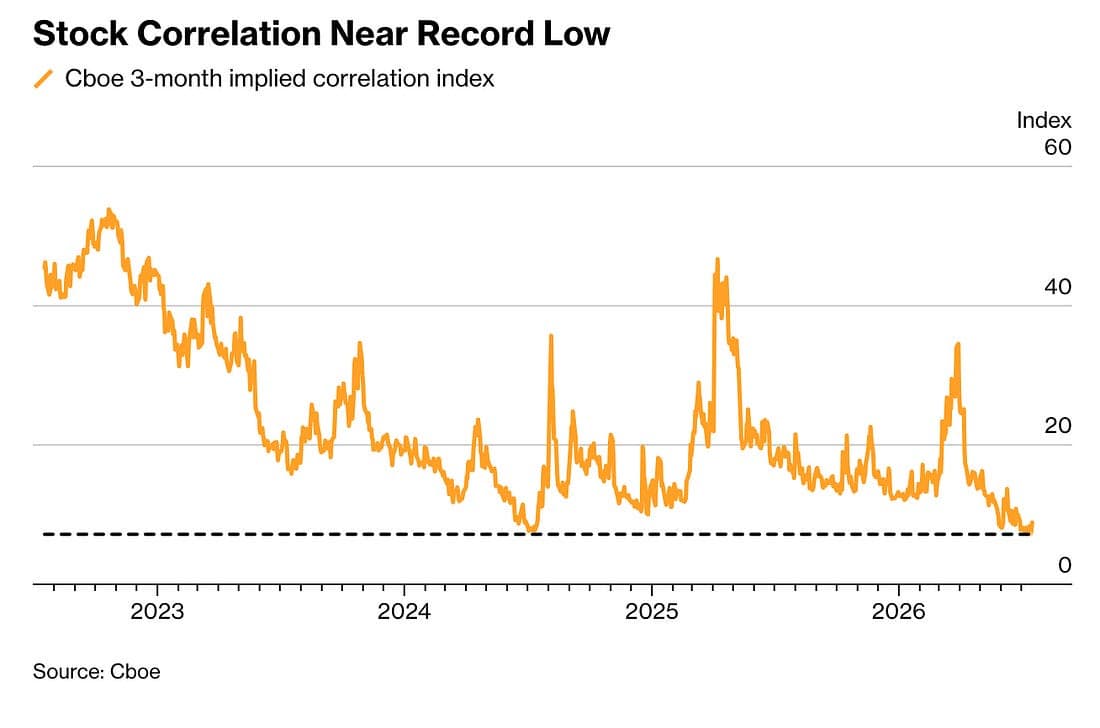
That calm may be more fragile than it looks. When correlation is already close to the floor, it does not take much of a macro shock to force stocks back into the same lane. A fresh oil spike, a policy surprise or a sharp change in growth expectations could quickly overwhelm company-specific stories and send the whole index moving together.
Adapt Investment Managers is positioning for precisely that outcome. Chief investment officer Alexis Maubourguet told Bloomberg that reverse dispersion remains one of the fund’s core trades, even after it proved to be its worst-performing position last quarter. The logic is deliberately asymmetric: accept a series of small losses while correlation remains depressed in exchange for potentially much larger gains if index volatility suddenly returns and stocks begin moving in unison.
The numbers help explain the attraction. Three-month implied correlation recently fell to around 7%, compared with a 10-year average near 33% and levels above 80% during the pandemic. Correlation cannot fall much below zero, but it can rise dramatically when the market is hit by a common shock. In that sense, reverse dispersion resembles buying insurance when the market has almost stopped believing the house can catch fire.
Traditional dispersion is also becoming increasingly crowded. Cboe’s Mandy Xu says more clients are now considering the opposite: selling single-stock volatility and buying index volatility, because relative pricing has become so extreme. The classic trade may continue to earn carry, but the entry point is no longer as generous as it once was.
The current earnings season is reinforcing the divide. Options markets are pricing larger moves for individual companies while expecting the S&P 500 itself to remain comparatively muted. Wells Fargo strategist Ohsung Kwon describes this as a structurally higher earnings-reaction environment, driven in large part by shifting expectations across artificial intelligence, semiconductors and Big Tech.
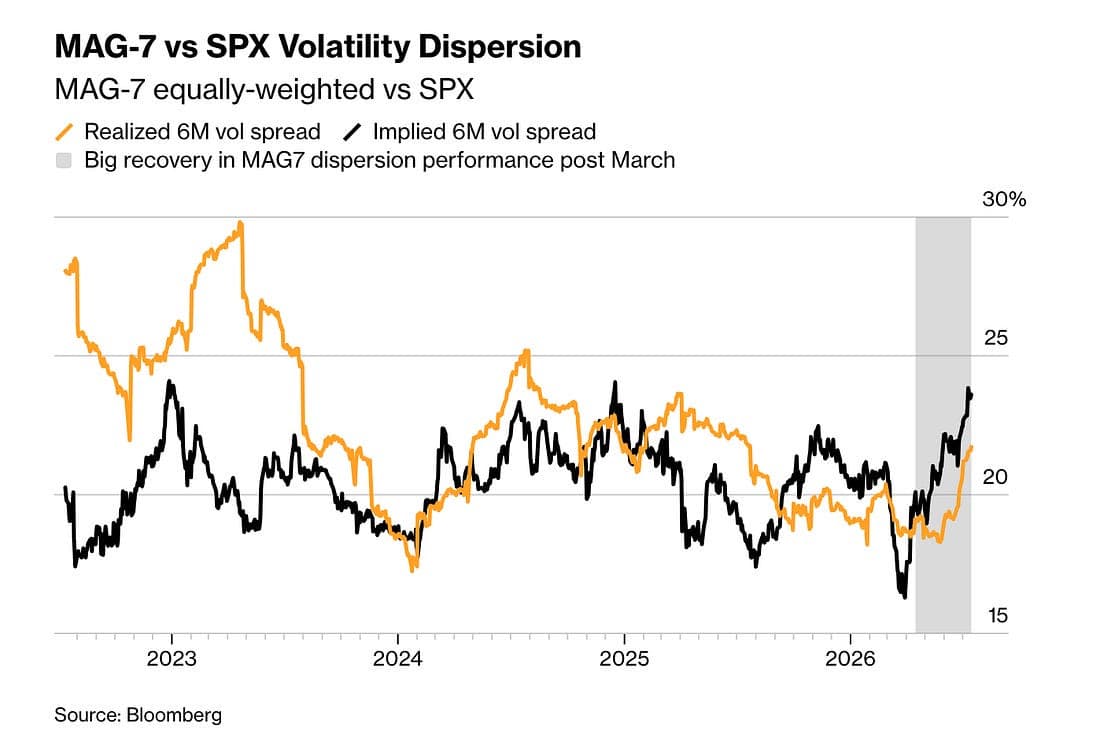
The Magnificent Seven have become the clearest expression of that split. Their implied and realized dispersion has surged since March as investors rotate between winners and losers inside the AI complex, even while the broader index barely moves. The storm is raging below deck, but the headline index still looks oddly steady from the shoreline.
Some investors are nevertheless approaching the reverse trade carefully. Selling single-stock volatility can become painful when earnings surprises trigger violent company-specific moves, so UBS derivatives strategist Kieran Diamond says many structures deliberately overweight the long index-volatility leg to avoid carrying too much naked short volatility in individual names.
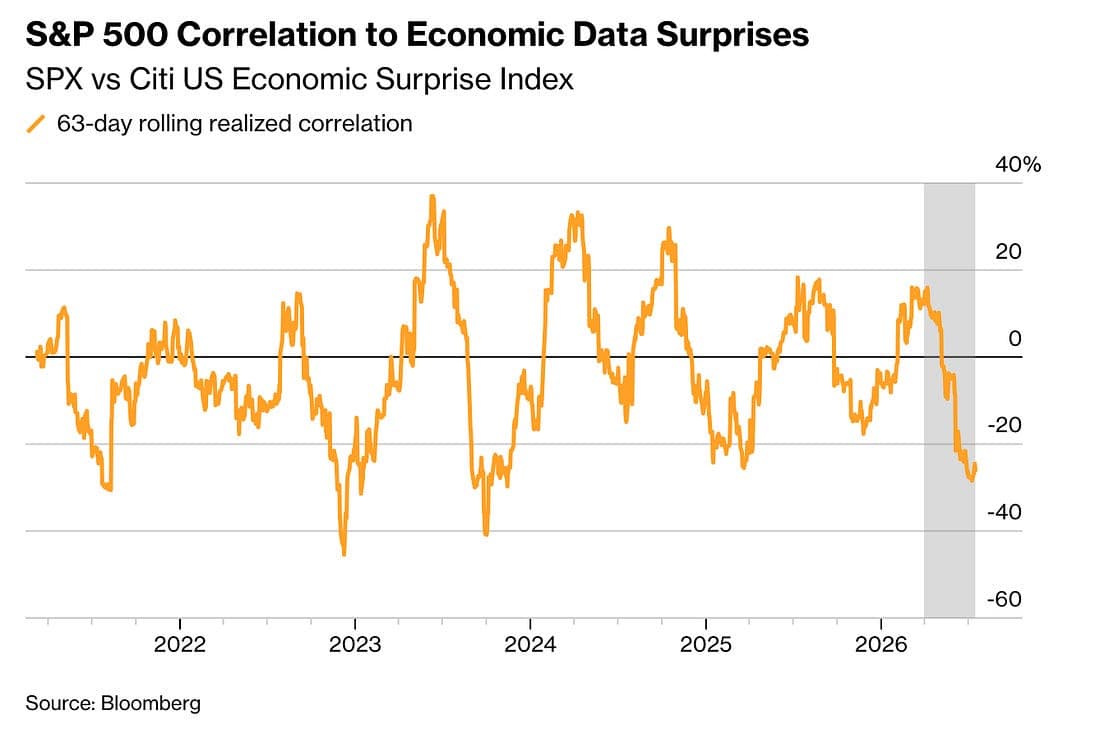
There is also a macro wrinkle. Citi strategist Scott Chronert notes that the S&P 500’s relationship with economic surprises has become increasingly negative, suggesting the index is being driven less by conventional data and more by the tug-of-war between AI enthusiasm and fear of missing the next move.
For now, dispersion remains profitable and deeply embedded. Yet every successful month attracts more capital, makes the trade more crowded and pushes correlation closer to its practical floor. The index may continue to look calm, but reverse-dispersion investors are betting that beneath that still surface, the market is storing energy for a much larger synchronized move.
Wealth daily: America is rich beyond measure, but the typical American is not
UBS economist Arend Kapteyn highlights one of the most revealing contradictions in the global wealth story. The United States holds an extraordinary share of the world’s private wealth, yet the typical American household ranks much lower in the international league table than the headline numbers suggest.
The US accounts for roughly 36% of global personal wealth, around 40% of the world’s millionaires and nearly one-third of all billionaires. In 2025 alone, the country added approximately 1,200 new dollar millionaires every day. Viewed from 30,000 feet, there is no serious contest. America remains the largest wealth-creation machine on the planet.
The picture changes dramatically once the mirror is tilted away from Wall Street and toward the middle of the distribution.
Kapteyn notes that US median wealth is roughly $69,000 per adult, placing the country only 28th among the markets covered by the UBS Global Wealth Report 2026. That leaves the typical American between Austria, at around $71,000, and Greece, at approximately $59,000, and well outside the global top 20.
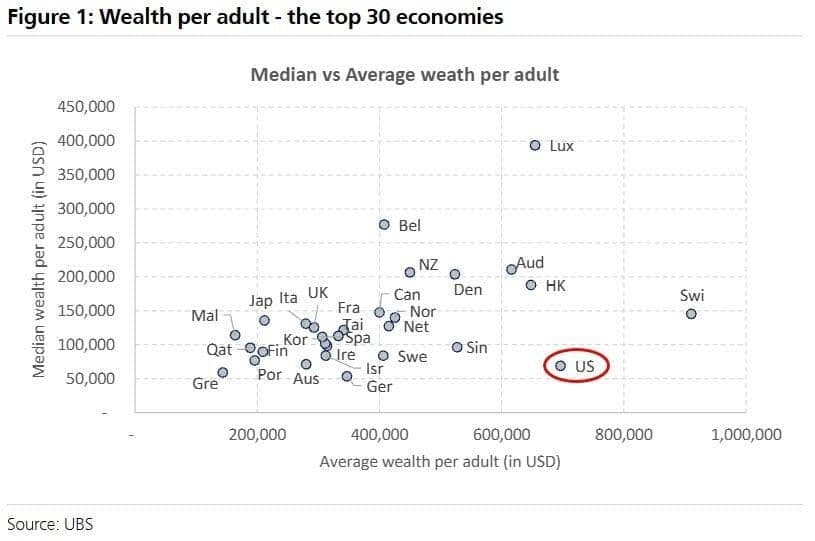
The leaders on median wealth look very different from the usual ranking of financial powerhouses. Luxembourg tops the table at roughly $394,000 per adult, followed by Belgium at $277,000, Australia at $211,000, New Zealand at $207,000 and Denmark at $204,000.
Median wealth is often the more useful measure when asking how the typical person is doing because it identifies the midpoint of the population rather than allowing a relatively small number of enormous fortunes to pull the figure higher. It is the difference between looking at the chandelier and checking whether the floorboards are still sound.
Switch the calculation from median to average wealth and the United States races back toward the top. On that measure, America ranks second globally at almost $700,000 per adult, trailing only Switzerland at around $910,000 and standing ahead of Luxembourg at approximately $655,000.
There is no statistical trick here. The enormous gap between America’s average and median wealth rankings is the story. The average is lifted by the sheer scale of assets held at the upper end of the distribution, while the median reveals that those gains are far less evenly spread across the population.
This is increasingly important for investors because aggregate wealth can create a misleading sense of economic strength. Rising equity markets, rising property values, and record billionaire fortunes can make the entire country look flush, even when much of the population has limited financial buffers and participates only marginally in the asset boom.
The US therefore remains exceptionally rich, but its wealth is concentrated in a way that makes the national balance sheet look stronger than the household experience felt by the middle. That helps explain why economic sentiment can remain weak even when stock markets are near record highs and total household net worth is rising.
Kapteyn’s comparison is a reminder that averages describe the size of the banquet, while medians tell us how many people actually received a plate. By the first measure, America is nearly unmatched. By the second, it is far closer to the middle of the advanced-world pack.
Author

Stephen Innes
SPI Asset Management
With more than 25 years of experience, Stephen has a deep-seated knowledge of G10 and Asian currency markets as well as precious metal and oil markets.