MNQ holds above 25,274 into New York as value forms near 25,355
Bulls need acceptance above 25,467 to target 25,637; a failure to reclaim 25,274 exposes 25,138 and 25,000
MNQ — Nasdaq futures macrostructure
London – New York trading desk report (Feb 12, 2026)
Market snapshot (mid-London)
The same four-day trading range is still doing the work: 25,467 at the top boundary, 25,274 (CP) as the decision point, and 25,138 as the lower boundary. That structure remains unchanged—price is simply rotating inside it.
As of this update, MNQ is trading above the CP and rotating around the POC near 25,355, with cumulative delta positive after stacking above the CP. That’s constructive heading into New York, but in a balanced market, it only matters if the auction can accept above the upper gate. Until then, this is still a range environment first, trend environment second.
Today’s structure map (into New York)
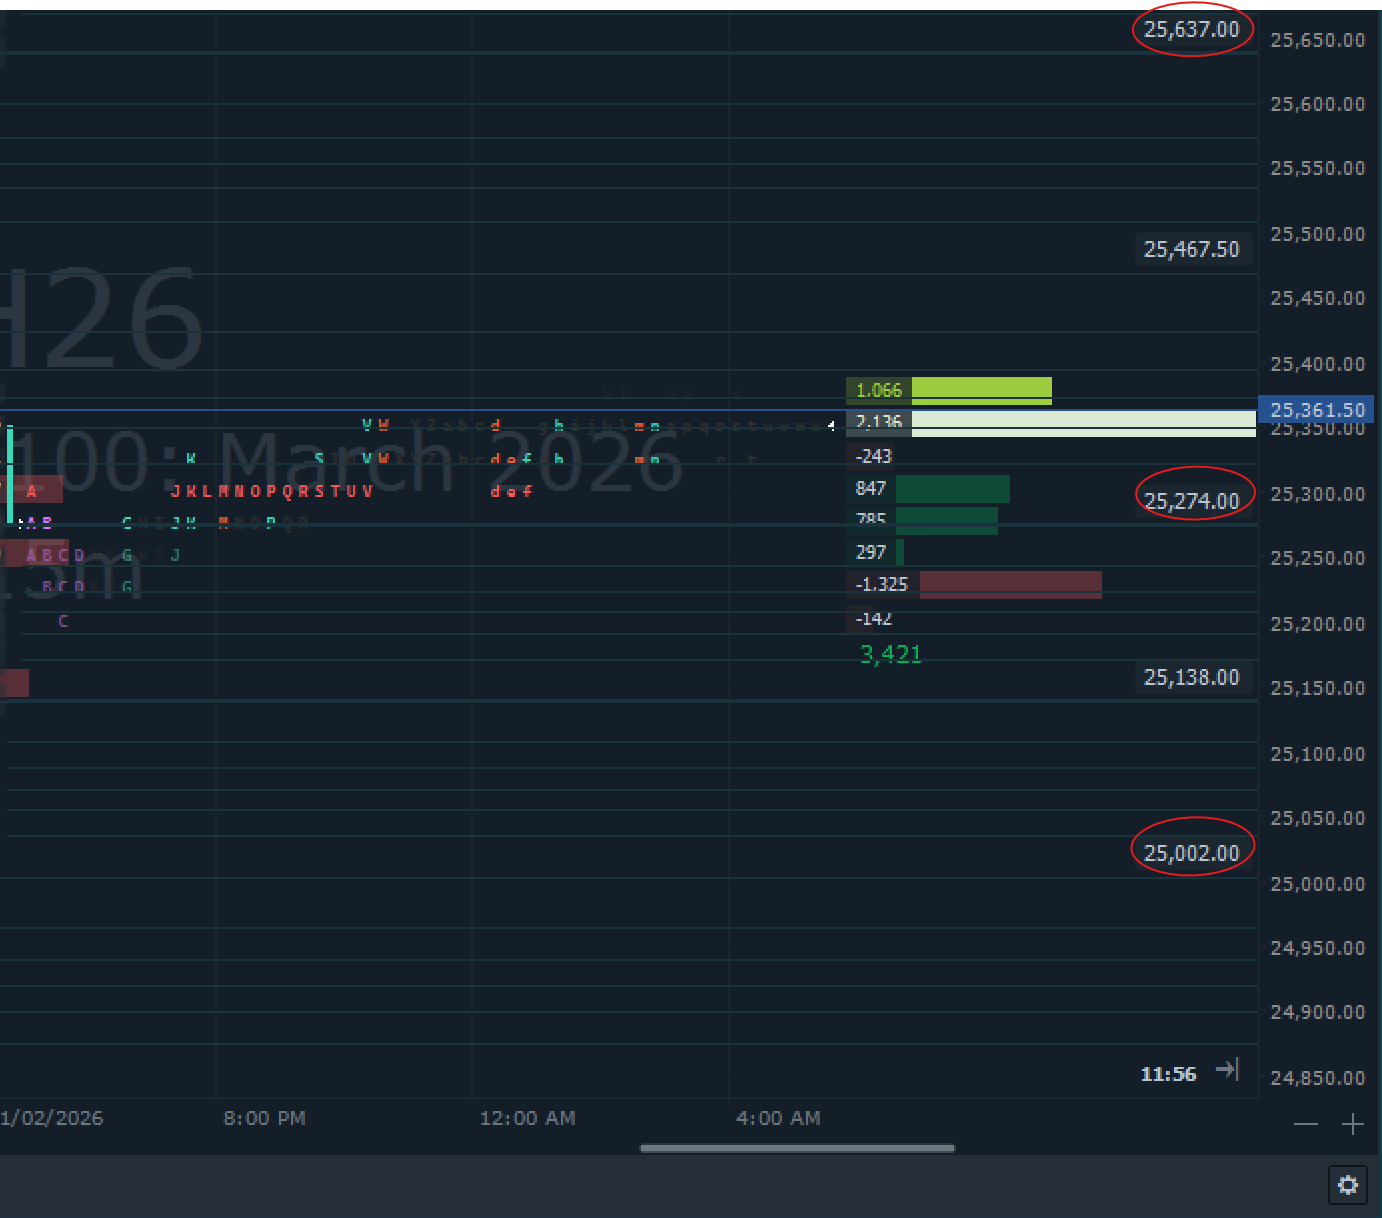
- Top range: 25,637.
- Upper gate (range ceiling reference): 25,467.
- Central Pivot (CP/decision point): 25,274.
- Lower gate: 25,138.
- Bottom range/pivot: 25,000.
- Current value focus: POC ~ 25,355.
Tape + order-flow read (what matters now)
A positive delta above the CP is a good start, but the decision is at 25,467. In balance, the market can print a positive delta and still revert if it can’t hold above the range ceiling. The next step is not simply “delta stays green”—it’s acceptance.
Acceptance definition (the executable part):
- Acceptance above 25,467: price pushes above and then holds above it on a retest (not just a wick through it).
- Rejection at 25,467: price pops above and quickly returns below, falling back into value.
A second piece to watch is value migration. If New York is truly transitioning from balance to expansion, you want to see the POC lift away from ~25,355. If POC stays pinned there while 25,467 keeps rejecting, the day is likely to remain rotational.
Execution principle: Trade the edges
This is still a range-first environment, which means the highest-quality opportunities tend to show up at the edges, not in the middle.
- Upper edge: 25,467 (upper gate) → potential short if rejected / potential long if accepted and held.
- Lower edge: 25,138 (lower gate) and 25,000 (bottom pivot) → potential long if defended / continuation short if failed and not reclaimed.
No-trade zone (high chop risk):
The 25,355–25,274 area is likely to behave like a magnet/mean-reversion zone. If price is parked here, the tape often becomes two-way, and conditions are less clean unless you’re specifically executing rotation.
Scenarios for New York
1) Expansion higher — Acceptance above 25,467
If price can reclaim 25,467 and hold it on the retest, the structure shifts from balance to expansion, and 25,637 becomes the next upside reference.
What you want to see:
- pullbacks defended above 25,467.
- value begins to migrate upward (POC lifting from ~25,355).
2) Rotation day — Rejection at 25,467, back to value
If 25,467 fails to convert and price returns below it, expect the market to rotate back into value with 25,355 as the magnet and 25,274 (CP) as the next key test. This is the “range stays a range” outcome.
3) Breakdown risk — sustained loss of CP (25,274)
The bear shift is not a brief dip under CP; it’s below CP + failure to reclaim it. If that occurs:
- 25,138 becomes the next “hold or fail” level.
- failure at 25,138 increases the odds of a fast test of 25,000.
Levels to respect (quick checklist)
- Above 25,467 (accepted): opens upside work – 25,637 in play.
- 25,467 rejected: rotation risk back to 25,355 – 25,274.
- Below 25,274 (and can’t reclaim): downside focus – 25,138, then 25,000.
Methodology
This desk report follows a structure-first process: define the active balance/range, mark decision points (CP) and gates (range boundaries), then observe whether price accepts or rejects those references. Direction is treated as an outcome of acceptance, not a prediction.
Technical FAQ
- What is CP? The central pivot of the active structure—where rotation often re-centres and where acceptance/rejection tends to decide the next phase.
- What is a “gate”? A boundary separating phases of trade (range ceiling/floor). Acceptance through a gate often expands the auction to the next reference.
- Why is POC important here? In balance, POC acts as a magnet. A rising POC is one of the cleaner signs that value is migrating and the auction is transitioning out of chop.
These desk updates document a structure-first process, observing how price accepts or rejects predefined levels over time. Coverage spans futures, commodities, forex, bonds, crypto, stocks, and indices, with structure providing context before direction. This observation is for informational purposes only and does not constitute financial advice.
Structure defines context; price reveals response.
Author

Denis Joeli Fatiaki
Independent Analyst
Denis Joeli Fatiaki possesses over a decade of extensive experience as a multi-asset trader and Market Strategist.


