|

MicroStrategy Inc.(MSTR) Elliott Wave technical analysis [Video]

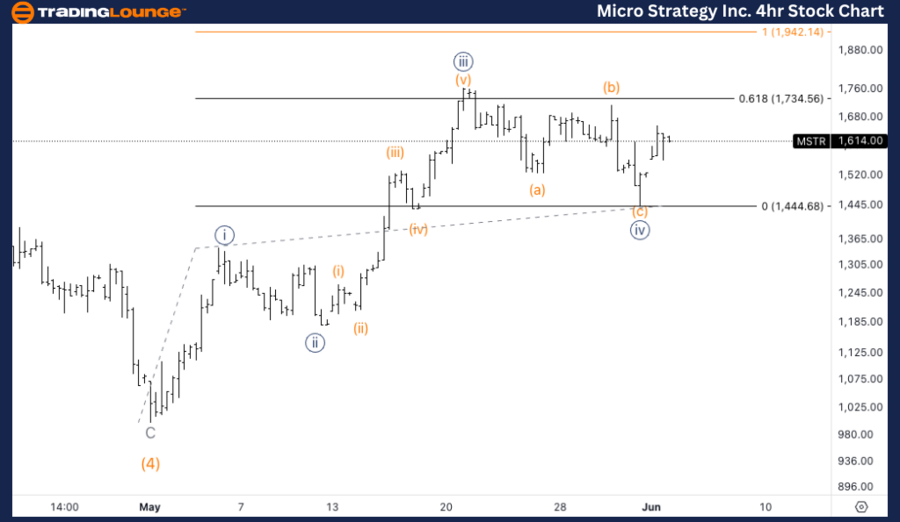
MicroStrategy Inc., ( MSTR) daily chart

MSTR Elliott Wave technical analysis

Function: Trend.

Mode: Impulsive.

Structure: Motive.

Position: Minor wave 1.  

Direction: Top in Minor wave 1.  

Details: Looking for a top in either Minor wave 1 or else Intermediate (5).

MSTR Elliott Wave technical analysis – Daily chart

Welcome to our latest Elliott Wave analysis for MicroStrategy Inc. (MSTR). This analysis provides an in-depth look at MSTR's price movements using the Elliott Wave Theory, helping traders identify potential opportunities based on current trends and market structure. We will cover insights from both the daily and 4-hour charts to offer a comprehensive perspective on MSTR's market behavior.

MSTR

MSTR Elliott Wave technical analysis – Four-hour chart

Welcome to our latest Elliott Wave analysis for MicroStrategy Inc. (MSTR). This analysis provides an in-depth look at MSTR's price movements using the Elliott Wave Theory, helping traders identify potential opportunities based on current trends and market structure. We will cover insights from both the daily and 4-hour charts to offer a comprehensive perspective on MSTR's market behavior.

Function: Trend.

Mode: Impulsive.

Structure: Motive.

Position: Wave {v} of 5.  

Direction: Upside in wave {v}.

Details: Looking for upside into wave {v}, with confirmation at the break of previous minuette wave (b). Equality of {v} vs. {i} stands at 1940$.  

Chart

MicroStrategy Inc.(MSTR) Elliott Wave technical analysis [Video]

Author

Peter Mathers

Peter Mathers

TradingLounge

Peter Mathers started actively trading in 1982. He began his career at Hoei and Shoin, a Japanese futures trading company.

More from Peter Mathers
Share:

Editor's Picks

EUR/USD climbs above 1.1600 on US–Iran peace breakthrough

The EUR/USD pair stays firm above 1.1600 in the European session on Monday. The US and Iran have reached a deal to reopen the Strait of Hormuz on Sunday, which underpins risk sentiment, supporting the Euro against the US Dollar. Now, the main focus this week remains on the Fed policy decision due on Wednesday.

GBP/USD: US-Iran reaches deal supporting advance beyond 20-day EMA

The GBP/USD pair trades 0.35% higher to near 1.3460 during the late Asian trading session. The Cable extends its week-long advance as market sentiment improves further, following the announcement that the United States and Iran have reached a deal.

Gold gains momentum as US, Iran announce a peace deal

Gold price rises to a weekly high during the early European trading hours on Monday. The precious metal rebounds after the United States and Iran had reached a deal to end their conflict, easing concerns about inflation and higher interest rates.


Bitcoin consolidates gains, Ethereum defends support, XRP nears breakout trigger


Bitcoin, Ethereum and Ripple begin the week on a constructive note as the top three cryptocurrencies attempt to extend rebounds after recovering nearly 4%, 2% and 2.6%, respectively. BTC steadies around $65,600, ETH continues to hold firmly above the key $1,700 support, while XRP nears the upper boundary of the falling channel pattern. 

President Trump announced that the deal with Iran is complete
President Trump announced that the deal with Iran is complete and he authorises the toll-free opening of the Strait of Hormuz and removal of the US Naval blockade. While the agreement is made, it is expected to be signed on Friday to take effect. The Forex market looks stable and could react slowly to the positivity around the news as Iran still expresses its mistrust on the US.
4.2% headline, 0.2% core: Why the Fed's next hike may be targeting the wrong problem

May's CPI put headline inflation at 4.2% on the year, up from 3.8% in April and the hottest reading since April 2023, while core prices rose just 0.2% on the month, undershooting the 0.3% consensus and halving April's pace.