META eyes a seven‑swing pullback while the larger bullish outlook supports further upside [Video]
![META eyes a seven‑swing pullback while the larger bullish outlook supports further upside [Video]](https://editorial.fxsstatic.com/images/i/facebook-01.jpg)
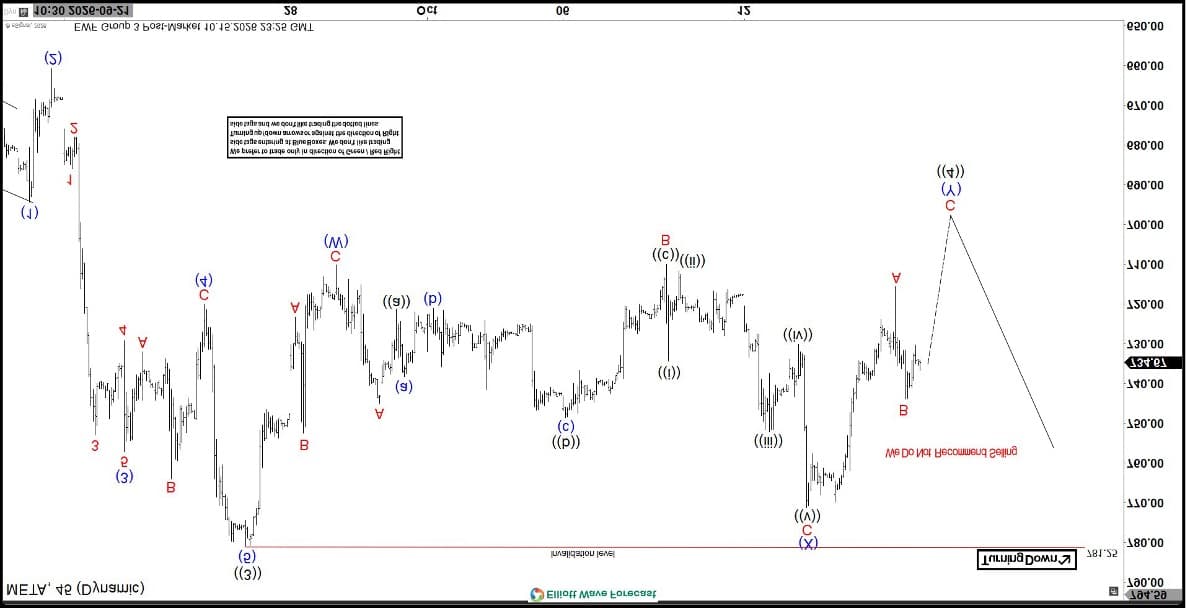
META has been advancing in a clear impulsive sequence since forming the low on July 29, 2026 at $517.5. The rally from that level established wave ((1)) at $612.43, followed by a measured pullback in wave ((2)) that reached $537.27. Momentum then strengthened as the stock pushed higher in wave ((3)), which extended toward $779.82 and confirmed the broader bullish structure. The current pullback in wave ((4)) is developing as a double three formation, which aligns with the typical corrective behavior seen after a strong third wave.
From the wave ((3)) peak, wave (W) declined to $710.15, creating the first leg of the double three. A subsequent recovery formed wave (X), which ended at $771.27 and provided a connector within the correction. The stock has since turned lower in wave (Y), and this leg is guiding price toward the 100%–161.8% Fibonacci extension of wave (W). That zone, located between $656.5 and $700.3, represents the ideal area for wave (Y) of ((4)) to conclude.
This region should attract buyers, as it aligns with both the structural expectations of a double three and the broader impulsive sequence from July. Once wave ((4)) completes, META should resume its upward trajectory or at least produce a three‑wave rally that reflects renewed demand. As long as the pivot at $779.82 remains intact, the corrective outlook stays valid and supports the potential for higher levels once the pullback matures.
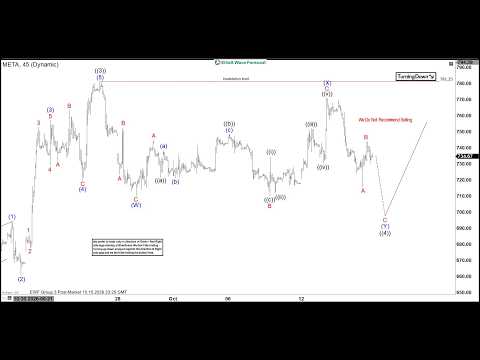
META 45 minute Elliott Wave chart
META Elliott Wave [Video]
Author

Elliott Wave Forecast Team
ElliottWave-Forecast.com

















