Is KE holdings (BEKE) heading for a massive breakthrough or a sudden drop? [Video]
![Is KE holdings (BEKE) heading for a massive breakthrough or a sudden drop? [Video]](https://editorial.fxstreet.com/images/Markets/Equities/FTSE/british-money-and-stock-exchange-graph-17512709.jpg)
China-based KE Holdings Inc. (BEKE), a real estate company that provides a platform for housing transactions and services, operates an integrated online and offline platform for housing transactions and services. The company operates in three segments and facilitates various housing transactions. Beike, launched in 2017, is a subsidiary of KE Holdings Inc. and operates as a real estate brokerage, online real estate marketing platform, and search engine. The company owns and operates Lianjia and Deyou, and reported owning 160 real estate brokerage brands with a combined total of 21,000 brokerage stores across 98 cities in China. The site received an average of 3.5 million visits per day in 2019. BEKE is listed on NYSE as ADR.
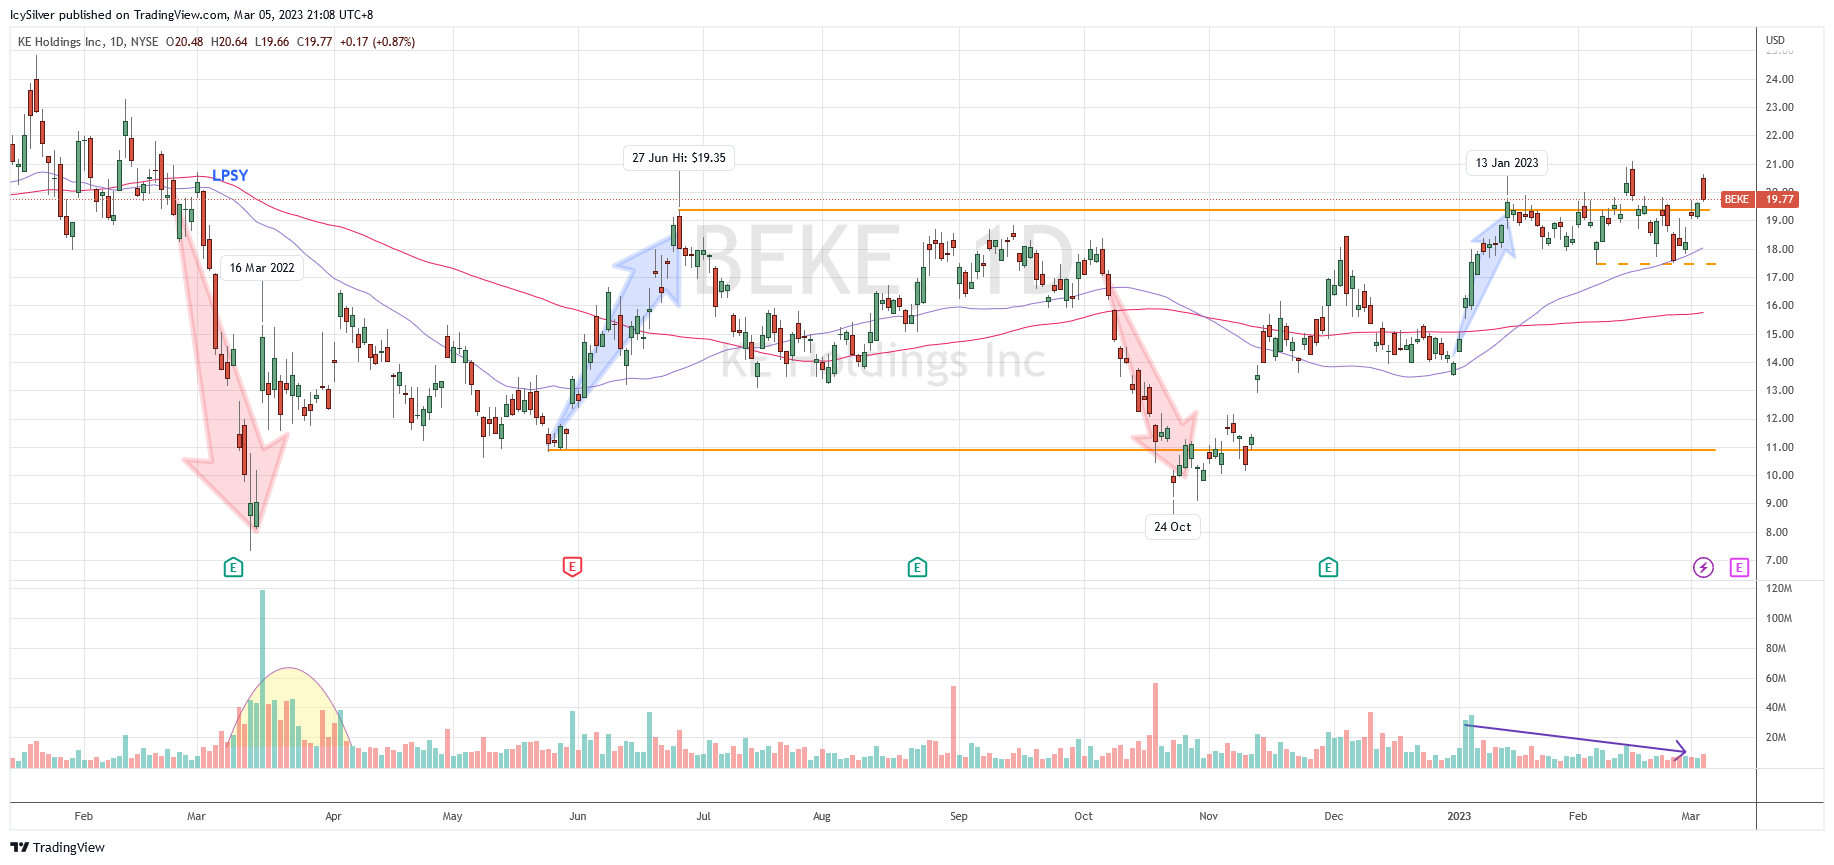
Wyckoff selling climax turned accumulation
BEKE started 2021 in the Wyckoff distribution phase and was in a down trend until August. It then bounced in a trading range before a Wyckoff last point of supply (LPSY) in March 2022 took the price down further. The Wyckoff sign of weakness (SOW) was impulsive with increased volume. BEKE formed a selling climax (SC) at $7.30 and the automatic rally on 16 Mar came with a big spike in volume, which was likely supply absorption by the institutional value investors.
Around late May, a Wyckoff sign of strength (SOS) rally began and reached $19.35, yet failed to hold above the support area at $15-$16, suggesting more consolidation ahead. There was another leg of shake out that broke the support of $11 but the price quickly rallied back into the range, confirming the trading range between $11-$19.35 is still unfolding.
BEKE started 2023 with a strong rally and attempted to break the resistance of $19.35 on 13 Jan. However, the price was unable to commit above the axis and retraced. It should be noted that the pull back is relatively shallow. Moreover, the volume during this period is decreasing without threatening supply to push the price down suggesting accumulation bias. The price is now consolidating in a narrow range between $17.50 and $19.35. There have been several attempts to challenge the resistance axis but has yet to commit above it.
Bias
Slightly bullish. According to the Wyckoff method, BEKE is still consolidating and trying to commit above the axis of $19.35. Should it be successful at breaking out from the trading range, the price would likely reach $25 as an immediate target.
If the price breaks below $17.50, it will likely retest the swing low of $15.50 followed by $13.50 with a prolonged consolidation in the trading range.
BEKE was discussed in detail in my weekly live group coaching on 14 Feb 2023 before the market opened. The improving market breadth together with many bullish trade entry setups could suggest a new bull run as discussed in the video below.
Author

Ming Jong Tey
Independent Analyst
Ming Jong Tey has been trading since 2008. He started his learning journey from technical analysis (indicators, Fibonacci, etc...) to value investing. Throughout his journey, he develops an interest in price action with chart pattern trading.

















