|

IONQ stock analysis: Resuming the uptrend after a brief correction

IONQ Inc., a trailblazer in quantum computing, specializes in developing and manufacturing quantum computers. Founded in 2015 by Christopher Monroe and Jung Sang Kim, the company is based in College Park, Maryland.

This technical analysis of IONQ’s weekly stock chart reveals key insights:

  • After a 3-wave pullback, the stock surged to new all-time highs.
  • This breakout confirms the potential for further growth, targeting the 65.84-73.16 range.
  • Based on this analysis, our recommendation is to hold onto your shares, as selling may not be the best strategy at this point.

IONQ Weekly Chart From 4.22.2025

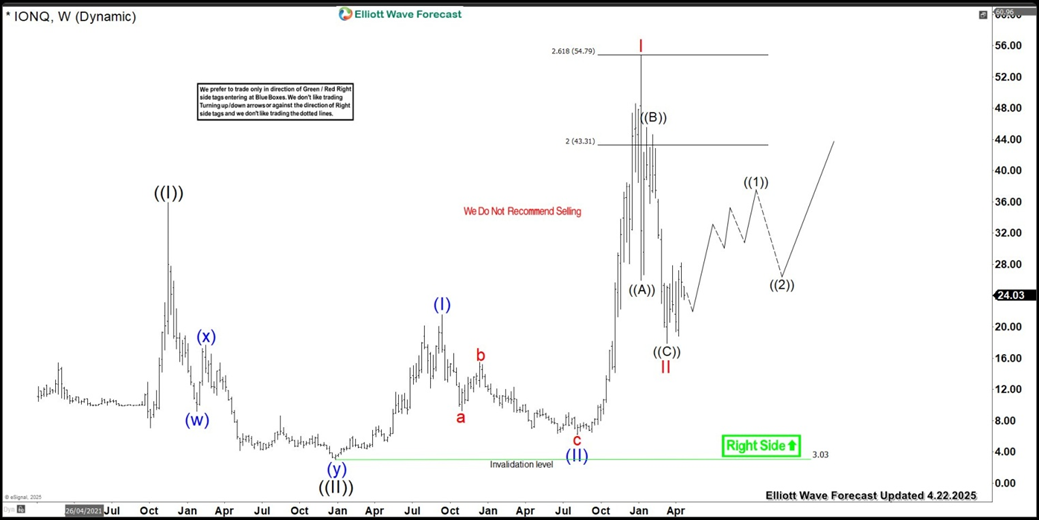
IONQ’s past update covered stock price action can be broken down as follows: The rally to $35.90 marked the end of wave ((I)), followed by a pullback that formed a double three structure. This pullback consisted of wave (w) ending at $9.16. A bounce in wave (x) to $17.66, and wave (y) concluding at $3.03.

Subsequently, the stock entered an impulse sequence, with wave (I) peaking at $21.60 and wave (II) correcting to $6.22. A strong rally ensued, culminating in wave I at $54.74, followed by a 3-wave pullback in wave II. This pullback unfolded as a zigzag correction: wave ((A)) ended at $25.92, wave ((B)) bounced to $45.56, and wave ((C)) concluded at $17.88.

IONQ Latest Elliott Wave Chart From 9.15.2025

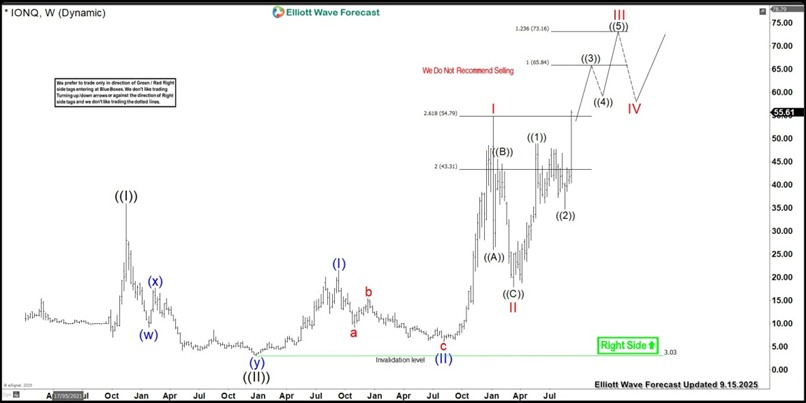
Since then, IONQ has surged to new all-time highs, indicating potential for further growth towards the $65.84-$73.16 range. Until this target is reached, dips are expected to remain supported within 3, 7, or 11 swings. Based on this analysis, selling is not recommended.

Author

Elliott Wave Forecast Team

Elliott Wave Forecast Team

ElliottWave-Forecast.com

More from Elliott Wave Forecast Team
Share:

Editor's Picks

EUR/USD recovers further from one-month low set on Friday, eyes mid-1.1800s on weaker USD

The EUR/USD pair is seen building on Friday's late recovery from the 1.1750-1.1740 region, or a nearly one-month trough, and gaining some follow-through positive traction at the start of a new week. The momentum lifts spot prices to the 1.1835 area during the Asian session and is sponsored by a broadly weaker US Dollar.

GBP/USD gathers strength above 1.3500 amid tariff confusion

The GBP/USD pair gains traction to around 1.3520 during the early Asian session on Monday. The US Dollar faces some selling pressure against the Cable as tariff uncertainty lingers. Traders will take more cues from the US Producer Price Index report for January, which will be published later on Friday. 

Gold rallies above $5,150 as Trump’s tariffs boost haven demand

Gold price extends the rally above $5,150 in the Asian session on Monday. The precious metal extends the rally amid US President Donald Trump’s tariff threats and uncertainty, which boost safe-haven flows. US-Iran geopolitical risks also linger, supporting the Gold price upside. 

Week ahead: Markets brace for heightened volatility as event risk dominates

Dollar strength dominates markets as risk appetite remains subdued. A Supreme Court ruling, geopolitics and Fed developments are in focus. Pivotal Nvidia earnings on Wednesday as investors question tech sector weakness. Yen and aussie diverge; both pound and euro could recoup their losses.

Liberation day take two, the tariff machine just changed gears

Let me caveat this from the outset. What we are watching is first-order mechanics, not the grand macro endgame. This is the market’s immediate reflex to a 15% Trump tariff levy dressed up as judicial drama. The Supreme Court blocked Trump tarrif hammer. The White House came back with a scalpel.

Ripple bulls defend key support amid waning retail demand and ETF inflows

XRP ticks up above $1.40 support, but waning retail demand suggests caution. XRP attracts $4 million in spot ETF inflows on Thursday, signaling renewed institutional investor interest.