India’s Wholesale Price Index Inflation rises strongly to 9.68% YoY in May: What it means for USD/INR?

India’s Wholesale Price Index (WPI) Inflation data for May arrives at 9.68% Year-on-Year (YoY), higher than 9.1% estimates and the previous reading of 8.3%.
There has been no immediate reaction by the Indian Rupee (INR) after the higher-than-projected India's WPI Inflation data release. However, it has been trading strongly since its opening against the US Dollar (USD) due to a juggernaut decline in oil prices. As of writing, USD/INR trades 0.54% lower at around 94.59, the lowest level seen in two weeks.
The table below shows the percentage change of Indian Rupee (INR) against listed major currencies today. Indian Rupee was the strongest against the US Dollar.
| USD | EUR | GBP | JPY | CAD | AUD | INR | CHF | |
|---|---|---|---|---|---|---|---|---|
| USD | -0.34% | -0.26% | -0.06% | -0.13% | -0.40% | -0.49% | -0.37% | |
| EUR | 0.34% | 0.08% | 0.30% | 0.24% | -0.06% | -0.01% | -0.04% | |
| GBP | 0.26% | -0.08% | 0.22% | 0.15% | -0.15% | -0.24% | -0.13% | |
| JPY | 0.06% | -0.30% | -0.22% | -0.05% | -0.35% | -0.31% | -0.35% | |
| CAD | 0.13% | -0.24% | -0.15% | 0.05% | -0.28% | -0.25% | -0.28% | |
| AUD | 0.40% | 0.06% | 0.15% | 0.35% | 0.28% | 0.03% | 0.07% | |
| INR | 0.49% | 0.01% | 0.24% | 0.31% | 0.25% | -0.03% | -0.03% | |
| CHF | 0.37% | 0.04% | 0.13% | 0.35% | 0.28% | -0.07% | 0.03% |
The heat map shows percentage changes of major currencies against each other. The base currency is picked from the left column, while the quote currency is picked from the top row. For example, if you pick the Indian Rupee from the left column and move along the horizontal line to the US Dollar, the percentage change displayed in the box will represent INR (base)/USD (quote).
What does hot India’s WPI Inflation data means for USD/INR?
Faster-than-expected growth in inflationary pressures in India at the wholesale level boosts expectations for interest rate hikes by the Reserve Bank of India (RBI) in the near term, a scenario that is favorable for the Indian Rupee.
In the monetary policy announcement on June 5, the RBI left its Repo Rate unchanged at 5.25%, but Governor Sanjay Malhotra warned that the central bank may “need to act” if high inflation due to elevated energy prices starts “generalizing”.
However, the impact of high WPI Inflation is expected to be limited now, as the announcement of the reopening of the Strait of Hormuz, a vital passage to one-fifth of global energy supply whose closure resulted in a significant surge in oil prices in the last few months, has eased crude oil prices and has anchored inflation expectations.
Technical Analysis: USD/INR falls below 20-day EMA
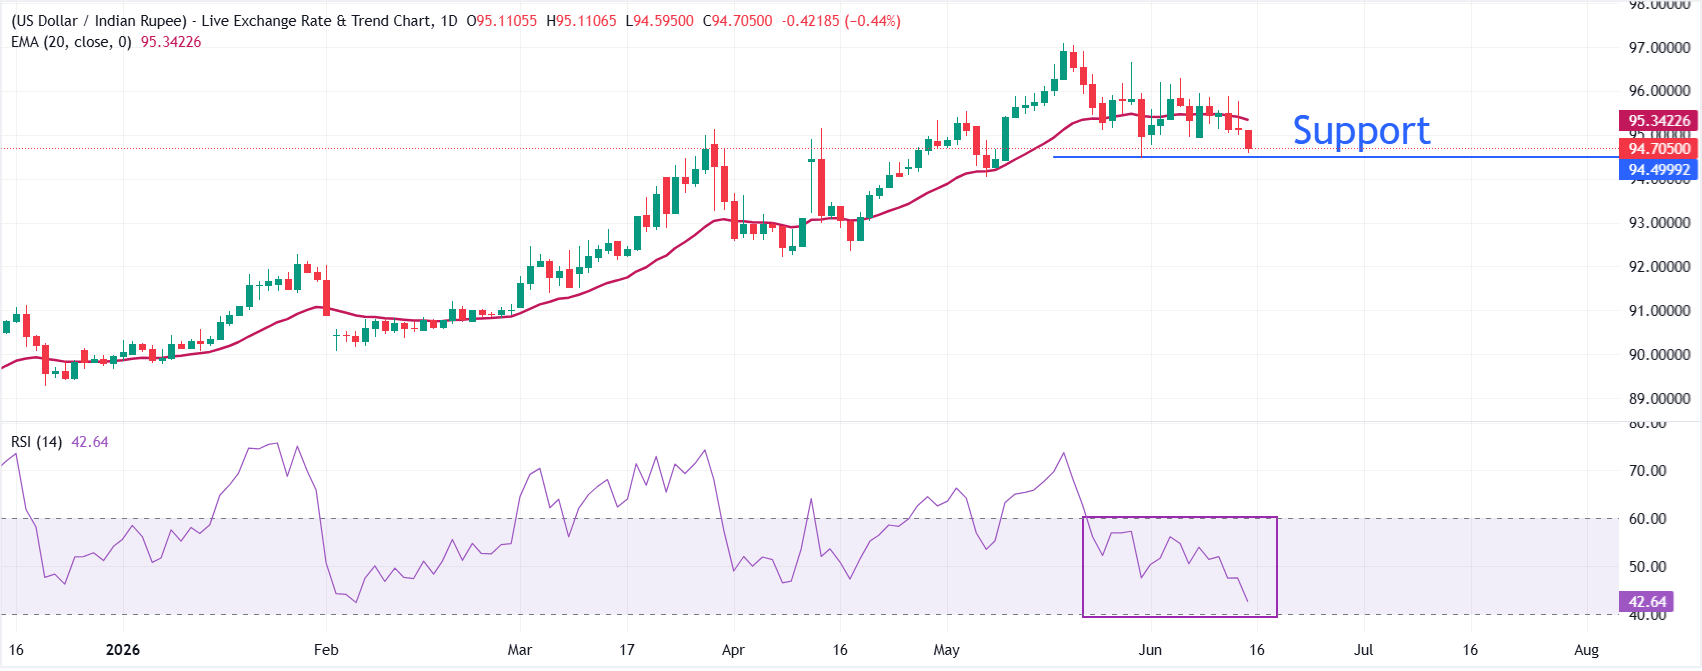
USD/INR trades lower at around 94.60, maintaining a bearish near-term tone as it holds beneath the 20-day exponential moving average (EMA) at 95.3423. The Moving Average Exponential (EMA) slopes slightly lower and sits overhead as immediate resistance, while the Relative Strength Index (RSI) at 42.6 hovers below the neutral 50 line, hinting at lingering downside pressure rather than a decisive oversold condition.
On the topside, initial resistance is defined by the 20-day EMA at 95.34, which would need to be reclaimed to ease the current downside bias and open the way for a more sustained recovery. On the downside, the pair could slide towards the May 7 low at 94.03 if it falls below the May 29 low at 94.46.
(The technical analysis of this story was written with the help of an AI tool.)
Economic Indicator
WPI Inflation
The WPI Inflation released by the Ministry of Commerce and Industry is a measure of price movements similar to the Consumer Price Indices (CPI). Generally, a high reading is seen as positive (or bullish) for the Rupee, while a low reading is seen as negative (or bearish).
Read more.Last release: Mon Jun 15, 2026 06:30
Frequency: Monthly
Actual: -
Consensus: 9.1%
Previous: 8.3%
Author

Sagar Dua
FXStreet
Sagar Dua is associated with the financial markets from his college days. Along with pursuing post-graduation in Commerce in 2014, he started his markets training with chart analysis.


