India’s Consumer Price Index accelerates to 3.93% YoY in May. What higher inflation means for USD/INR?

India’s Consumer Price Index data for May has come in at an annualized pace of 3.93% in May, slower than 4% estimates, but higher than the previous reading of 3.48%.
No major movement seen in the Indian Rupee, following the release of India’s CPI data for May. Currently, the global market is responding to headlin relating to the United States (US)-Iran Memorandum of Understanding (MoU), which is expected to be signed by the weekend in Geneva.
As of writing, the USD/INR pair trades lower 0.8% lower to near 95.00 as the Indian Rupee is performing strongly due to plummeting oil prices.
The table below shows the percentage change of Indian Rupee (INR) against listed major currencies today. Indian Rupee was the strongest against the Canadian Dollar.
| USD | EUR | GBP | JPY | CAD | AUD | INR | CHF | |
|---|---|---|---|---|---|---|---|---|
| USD | 0.04% | 0.04% | 0.08% | 0.13% | 0.08% | 0.00% | 0.15% | |
| EUR | -0.04% | -0.02% | 0.04% | 0.09% | 0.04% | -0.72% | 0.10% | |
| GBP | -0.04% | 0.02% | 0.09% | 0.11% | 0.03% | -0.01% | 0.12% | |
| JPY | -0.08% | -0.04% | -0.09% | 0.03% | -0.03% | -0.76% | 0.04% | |
| CAD | -0.13% | -0.09% | -0.11% | -0.03% | -0.06% | -0.83% | 0.01% | |
| AUD | -0.08% | -0.04% | -0.03% | 0.03% | 0.06% | -0.78% | 0.06% | |
| INR | -0.01% | 0.72% | 0.01% | 0.76% | 0.83% | 0.78% | 0.83% | |
| CHF | -0.15% | -0.10% | -0.12% | -0.04% | -0.01% | -0.06% | -0.83% |
The heat map shows percentage changes of major currencies against each other. The base currency is picked from the left column, while the quote currency is picked from the top row. For example, if you pick the Indian Rupee from the left column and move along the horizontal line to the US Dollar, the percentage change displayed in the box will represent INR (base)/USD (quote).
What does India’s higher CPI growth means for USD/INR?
Unlike the developed nations, whose currencies are significantly influenced by their inflation data, the impact of India’s CPI data remains limited on the Indian Rupee.
Technically, accelerating inflationary pressures will likely prompt expectations of an interest rate hike by the Reserve Bank of India (RBI) in the near term. In the monetary policy announcement last week, RBI Governor Sanjay Malhotra stated that the central bank would need to act if inflation growth starts generalizing.
However, the impact of the higher inflation data would fizzle out if the US and Iran sign the MoU, assuming that the move will lead to a sharp decline in oil prices and eventually anchor inflation expectations.
Technical Analysis: USD/INR falls toward upward-sloping border of Symmetrical Triangle pattern
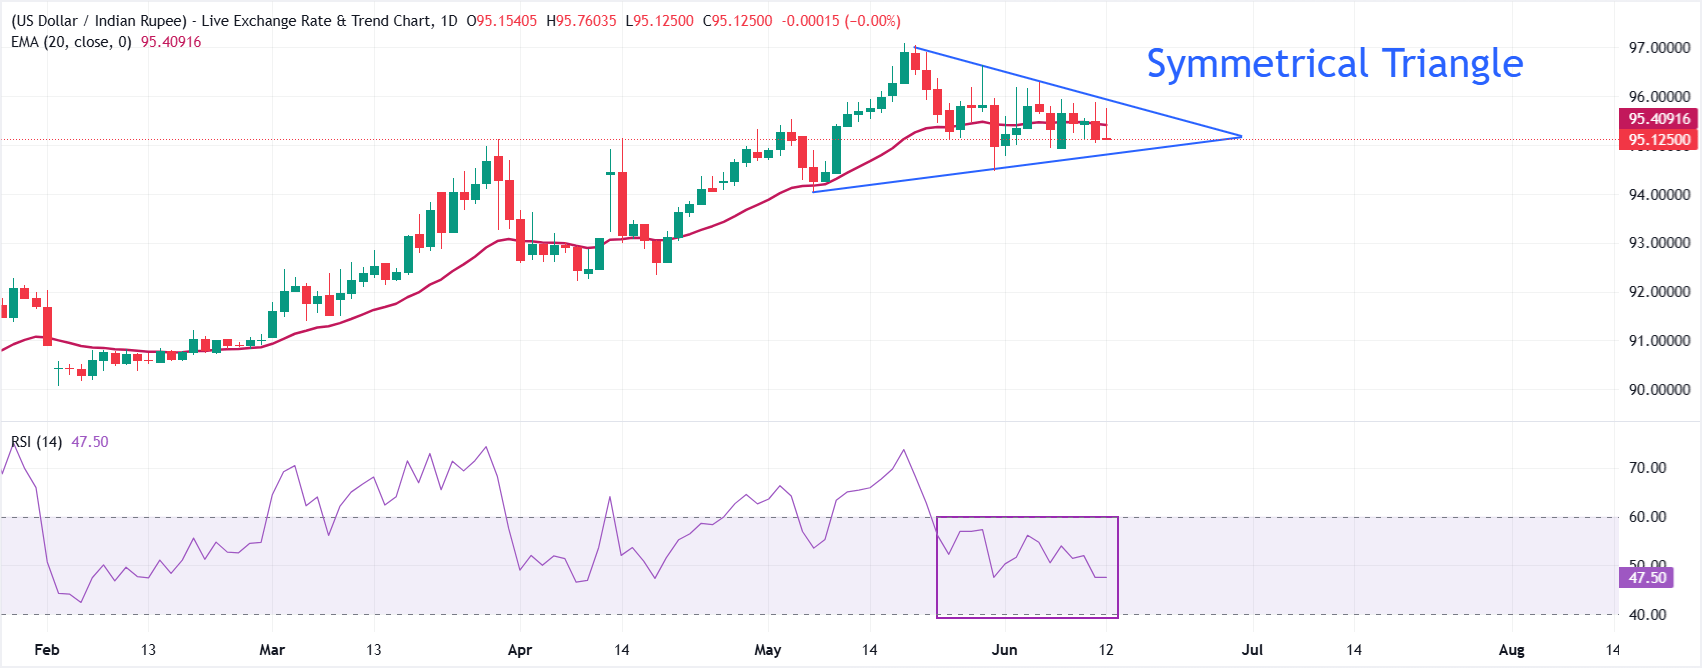
USD/INR trades sharply lower at around 95.12, keeping a bearish near-term tone as spot holds beneath the 20-day Exponential Moving Average (EMA) at 95.41.
The failed push above the downtrend resistance line, which now comes in around 95.9636, leaves the pair capped, while the Relative Strength Index (RSI) near 47 hints at fading momentum rather than an imminent reversal.
On the topside, immediate resistance is seen at the 20-day EMA near 95.41, with the descending resistance trend line around 95.96 acting as a stronger barrier if bulls attempt a rebound. On the downside, initial support is aligned with the broken-uptrend area around 94.79, and a sustained break below this zone would reinforce the bearish structure and expose deeper losses toward the May 7 low at 94.03.
(The technical analysis of this story was written with the help of an AI tool.)
Economic Indicator
Consumer Price Index (YoY)
The India Consumer Price Index released by the Ministry of Statistics and Programme Implementation measures the average price change for all goods and services purchased by households for consumption purposes. CPI is the main indicator to measure inflation and changes in purchasing trends. A high reading is positive (or bullish) for the INR, while a low reading is negative (or bearish).
Read more.Last release: Fri Jun 12, 2026 10:30
Frequency: Monthly
Actual: 3.93%
Consensus: 4%
Previous: 3.48%
Author

Sagar Dua
FXStreet
Sagar Dua is associated with the financial markets from his college days. Along with pursuing post-graduation in Commerce in 2014, he started his markets training with chart analysis.


