|

Hut 8 Corp (HUT) bullish reversal targets $154

Hut 8 Corp (NASDAQ: HUT) more than doubled earlier this year. Then, it started a correction from its June peak. In today’s video blog, we inspect its current Elliott Wave structure. Our analysis explains the potential upside target based on this technical setup.

Elliott Wave analysis

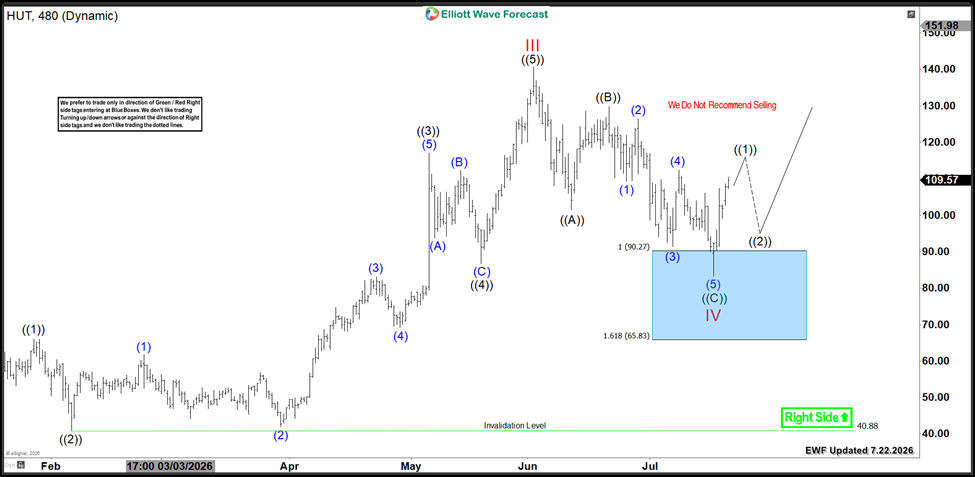
HUT completed a five-wave advance in wave III at $66.07 in June 2026. Since then, it formed a three-wave zigzag structure (A-B-C). Wave ((A)) ended at $101.5. Subsequently, wave ((B)) bounced to $129.88. Then, wave ((C)) traded lower into the buying Blue Box at the equal legs area $90.27 – $65.83 .

Wave IV is marked at the recent low of $83.30. From there, the stock is reacting to the upside. It will either resume the rally to new highs or bounce in three waves at minimum. As long as HUT stays above $83.30, it should aim for the upside target $154 – $176 .

However, if the stock fails to break into new highs, it could turn lower again. A double three correction in wave IV would then unfold. This would push HUT below $90 again. That would create another buying opportunity at the next extreme area.

HUT 8 Hour chart 7.22.2026
Chart

Conclusion

HUT maintains a strong bullish trend. The stock appears ready for a new upside extension. However, bulls should remain cautious. Another dip remains a possibility.

Get More Insights Today

Learn to trade our Blue Boxes using the 3, 7, or 11 swings sequence. Try our services with a 14-day trial.

You will gain access to:

  • 78 instruments updated across 4 different time frames.
  • Live Trading & Analysis Sessions with our Expert Analysts every day.
  • 24-hour chat room support and much more.

Author

Elliott Wave Forecast Team

Elliott Wave Forecast Team

ElliottWave-Forecast.com

More from Elliott Wave Forecast Team
Share:

Editor's Picks

GBP/USD dips below 1.3350 as USD demand surges

GBP/USD extends its intraday slide and closes in on 1.3300 in the American session on Thursday. The pair remains under heavy bearish pressure as the US Dollar (USD) benefits from the risk-averse market atmosphere amid escalating geopolitical tensions in the Middle East.

EUR/USD drops toward 1.1350 post ECB decision

EUR/USD remains under heavy bearish pressure in the second half of the day on Thursday and trades at its lowest level in three weeks below 1.1370. The ECB's cautious tone on policy tightening in the near future and the broad-based US Dollar (USD) strength on risk-aversion drag the pair lower.

Gold slides further below $4,100 as Middle East tensions escalate

Gold keeps retreating on Thursday, trading well below $4,100 early in the American session. US crude oil prices climb to a fresh six-week high above $90 amid a further escalation of tensions between the US and Iran, fueling inflation fears and bolstering US Fed interest rate hike expectations. Hawkish Fed bets weigh negatively on the yieldless bullion.

XRP Price Forecast: XRP trades sideways as Ripple targets 10 million agentic AI transactions
Ripple (XRP) is losing momentum on Thursday, albeit gradually, trading above $1.13. The remittance token tagged a weekly high of $1.16 on Tuesday, with gains mainly attributed to developments on the United States (US) Clarity Act and recent signs that inflation is easing in the world’s largest economy.
Bitcoin falls as surging Oil prices revive inflation concerns

Bitcoin extends its correction, trading below $65,800 after a modest decline in the previous day. Despite BTC’s fading strength, US-listed spot Bitcoin Exchange Traded Funds continued to attract institutional inflows on Wednesday, marking the seventh consecutive day of gains.

US Dollar mid-year outlook: Exceptional currency, exceptional risks?
The US Dollar enters the second half of 2026 in a markedly different position from a year ago. The King currency has recovered, reflecting persistent US inflation, changing expectations for Fed policy, geopolitical tensions and renewed demand for defensive assets.
















