|

HPE remains bullish with key support at 52.85-40.11

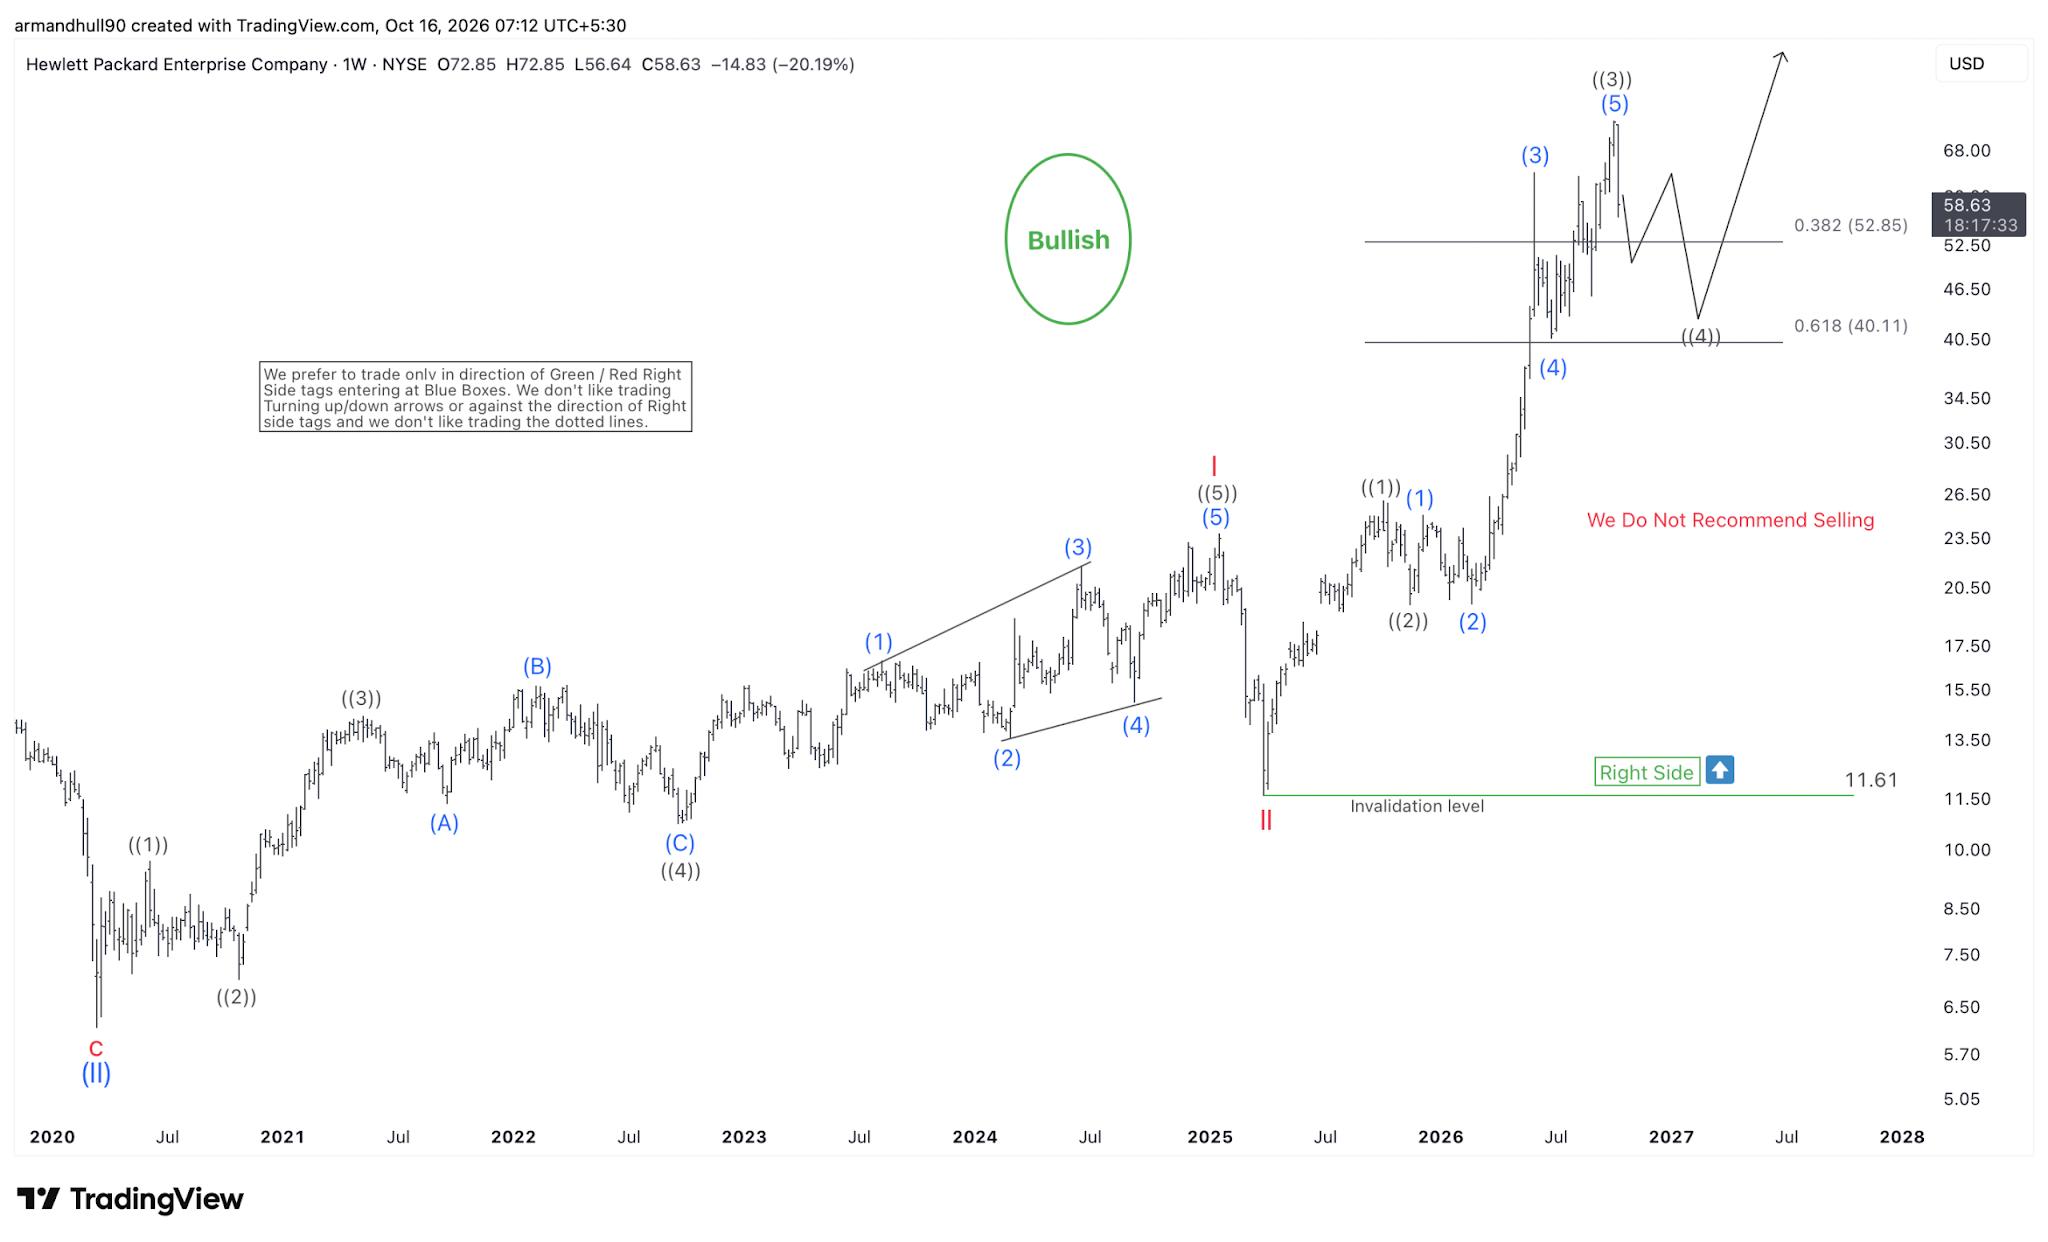
Hewlett Packard Enterprise (NYSE: HPE) maintains a bullish long-term Elliott Wave outlook despite its recent decline. The weekly chart suggests that an impulsive rally from the $11.61 low has completed wave ((3)), leaving the stock vulnerable to a corrective wave ((4)) before another potential advance.

HPE Elliott Wave structure

Following the major wave II bottom at $11.61, HPE is showing an incomplete bullish sequence in three swings which appears to have completed the larger-degree wave ((3)) near the recent highs. The latest weekly candle shows a sharp pullback, consistent with the possibility that wave ((4)) is beginning. Corrections often unfold through multiple swings rather than a straight decline. Consequently, an initial bounce would not necessarily mean the correction has finished. The projected chart path illustrates a rebound followed by another dip before the larger uptrend resumes.
HPE

HPE stock forecast: Support levels

The key area to monitor is 40.11, corresponding to the 38.2% and 61.8% Fibonacci retracement levels of wave ((3)) marked on the chart. This zone may attract buyers as wave ((4)) develops. Price could react near $52.85 initially, while a deeper correction toward $40.11 remains possible.

The chart identifies $11.61 as the long-term Elliott Wave invalidation level. However, this distant level should not be confused with a practical stop-loss for short-term positions.

What’s next for HPE?

If wave ((4)) completes above the structural invalidation level, HPE could begin another bullish sequence and eventually challenge the wave ((3)) high. Confirmation would require evidence that the correction has ended and upward momentum is returning.

Overall, our HPE Elliott Wave analysis favors buying opportunities after a corrective structure completes rather than selling into the broader trend. The40.11 region remains the principal area to watch, although projected support and upside targets are not guaranteed. The weekly trend continues to favor buyers over sellers.

Author

Elliott Wave Forecast Team

Elliott Wave Forecast Team

ElliottWave-Forecast.com

More from Elliott Wave Forecast Team
Share:

Editor's Picks

AUD/USD rises to 0.6950 as USD slips on Fed's Warsh

AUD/USD regains traction and extends the bounce toward 0.6950 in the Asian session on Friday. Fed Chair Warsh's comments reinforce the selling pressure on the US Dollar, allowing the pair to stretch higher. Warsh said that he remains committed to delivering price stability without giving away anything on future interest rate path.

USD/JPY falls in symc with USD, gives up 158.00 after Warsh's speech

USD/JPY has come under fresh selling pressure and gives up 158.00 in the Asian session on Friday amid the emergence of fresh US Dollar selling. Fed Chair Warsh's non-committal commentary on the future tightening path, weighs on the US Dollar and the pair.

Gold looks vacillating above $4,150

Gold alternates gains with losses below the key $4,200 mark per troy ounce on Friday. The yellow metal’s irresolute price action comes in response to a modest pullback in the US Dollar and a tepid recovery in US Treasury yields across the board.

Bitcoin steadies at $82,000: The five forces crushing the Uptober rally

Crypto markets have remained under pressure so far in October, with Bitcoin (BTC) sliding below $80,000 earlier this week before recovering to around $82,000 on Friday, as macroeconomic headwinds and cooling demand weigh on the market.

The Fed just got a second hot inflation number. Here's what the diesel signal is really saying
The Federal Reserve (Fed) faces a renewed inflation challenge after two consecutive reports showed price pressure intensifying across the US economy. September's Consumer Price Index (CPI) confirmed accelerating consumer inflation, while the Producer Price Index (PPI) revealed an even sharper rise in business costs. Behind both reports lies a common factor: energy prices.
Everyone's dumping Gold after hot US inflation. Here's why $4,100 could be a floor, not a cliff
Gold (XAU/USD) is recovering from a sharp sell-off triggered by hotter-than-expected United States (US) inflation data released on Wednesday. The precious metal briefly plunged toward $4,073 as investors increased their bets on further Federal Reserve (Fed) interest rate hikes before recovering as US Treasury yields and the US Dollar (USD) reversed their initial gains.
















