Goldman Sachs (GS) strategic buying zone below $1000

Goldman Sachs (NYSE: GS) is down 20% from its peak. Investors now wonder if the stock has entered a bear market. In today’s article, we examine the current Elliott Wave structure unfolding. Our analysis explains the bullish case supporting a resumption of the uptrend.
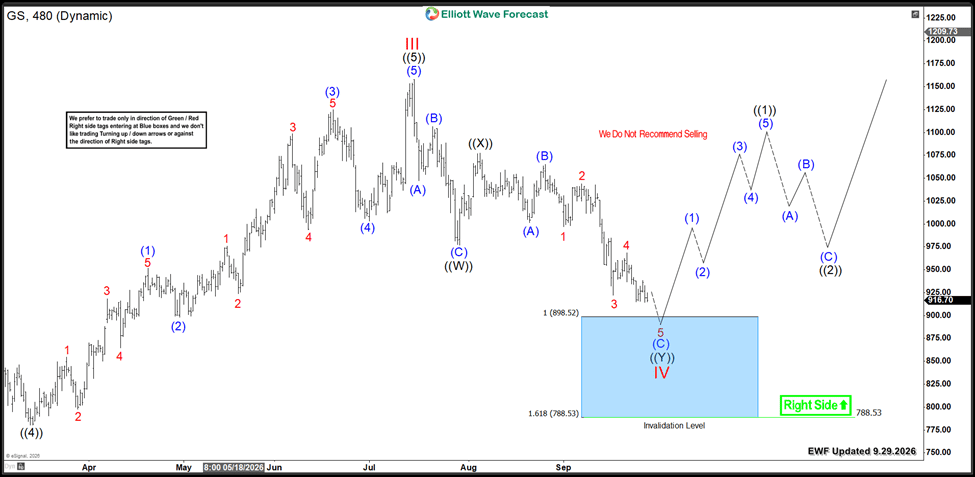
GS marked the wave III peak on July 15, 2026, at $1154. Then, it started a corrective decline in wave IV.
The current move from the peak unfolds within a seven-swing structure. This pattern is labeled as a double three (W-X-Y). Wave ((W)) ended at $977, followed by wave ((X)) at $1077. Now, wave ((Y)) remains in progress. The internal short-term structure of wave ((Y)) suggests a zigzag A-B-C pattern. Wave C aims to reach the main Blue Box at the equal legs area $898 – $788 .
This extreme buying area should trigger a market reaction higher. Consequently, Goldman Sachs bulls should enter within this zone. They will create a bullish reaction in the coming weeks. This move should resume the uptrend within wave V toward new all-time highs.
However, until the stock breaks above the July peak, downside risk remains. It could turn lower again after a three-wave bounce instead of the new bullish impulsive five-wave advance. An 11-swing correction to the downside would then unfold within wave IV. That move would create the next buying opportunity.
Goldman Sachs (GS) eight-hour chart 9.29.2026
Author

Elliott Wave Forecast Team
ElliottWave-Forecast.com