Gold subdued as mixed US-Iran signals keep investors cautious amid ongoing war
- Gold struggles to extend gains as Middle East tensions and mixed US-Iran signals keep investors cautious.
- Stronger US Dollar and higher Treasury yields cap Gold’s upside.
- XAU/USD maintains a bearish bias on the 4-hour chart, with RSI below the midline and price below the 50- and 100-period SMAs.

Gold (XAU/USD) trades with a subdued tone on Tuesday, struggling to build on the previous day’s rebound as investors continue to assess geopolitical developments in the Middle East amid conflicting signals from the United States and Iran over potential negotiations.
At the time of writing, XAU/USD trades around $4,425, bouncing from an intraday low of $4,306.
On Monday, US President Donald Trump postponed planned military strikes on Iranian energy infrastructure for five days, citing constructive discussions between the US and Iran. The move improved overall market sentiment, raising hopes that a resolution could be reached soon and helping Gold stage a sharp rebound from year-to-date lows near $4,098.
However, the recovery lacked strong follow-through buying after Iranian officials denied that any negotiations were taking place, leaving investors cautious about the prospect of a prolonged war.
Traders also digested preliminary US Purchasing Managers Index (PMI) data, which showed business activity slowed in March, with the S&P Global PMI easing to 51.4 from 51.9, marking an 11-month low.
The slowdown was led by the services sector, where the PMI fell to 51.1 from 51.7, also an 11-month low, while manufacturing showed relative resilience, with the PMI rising to 52.4 from 51.6.
Oil-driven inflation and interest rate outlook overshadow safe-haven demand
As the conflict continues in the Middle East and the Strait of Hormuz remains effectively closed, Bullion’s price action will remain driven by Oil-led inflation risks and the resulting “higher-for-longer” global interest rate narrative, overshadowing its safe-haven appeal.
Markets have largely priced out bets on Federal Reserve (Fed) rate cuts for this year and now expect the central bank to keep interest rates unchanged through 2026.
For Gold, this creates a challenging backdrop. While the metal is traditionally seen as a hedge against inflation, the sharp repricing has pushed US Treasury yields higher and kept the US Dollar (USD) broadly supported, both of which weigh on the non-yielding asset.
At the same time, with both Oil and Gold priced in USD, elevated crude prices are indirectly boosting demand for the Greenback, further adding pressure on the precious metal.
Meanwhile, traders are increasingly raising liquidity by selling assets across the board, as reflected in sustained pressure in global equities since the conflict escalated, with Gold also being sold to meet margin calls, reduce risk exposure, and preserve capital as volatility rises.
Technical analysis: Sellers remain in control below key moving averages
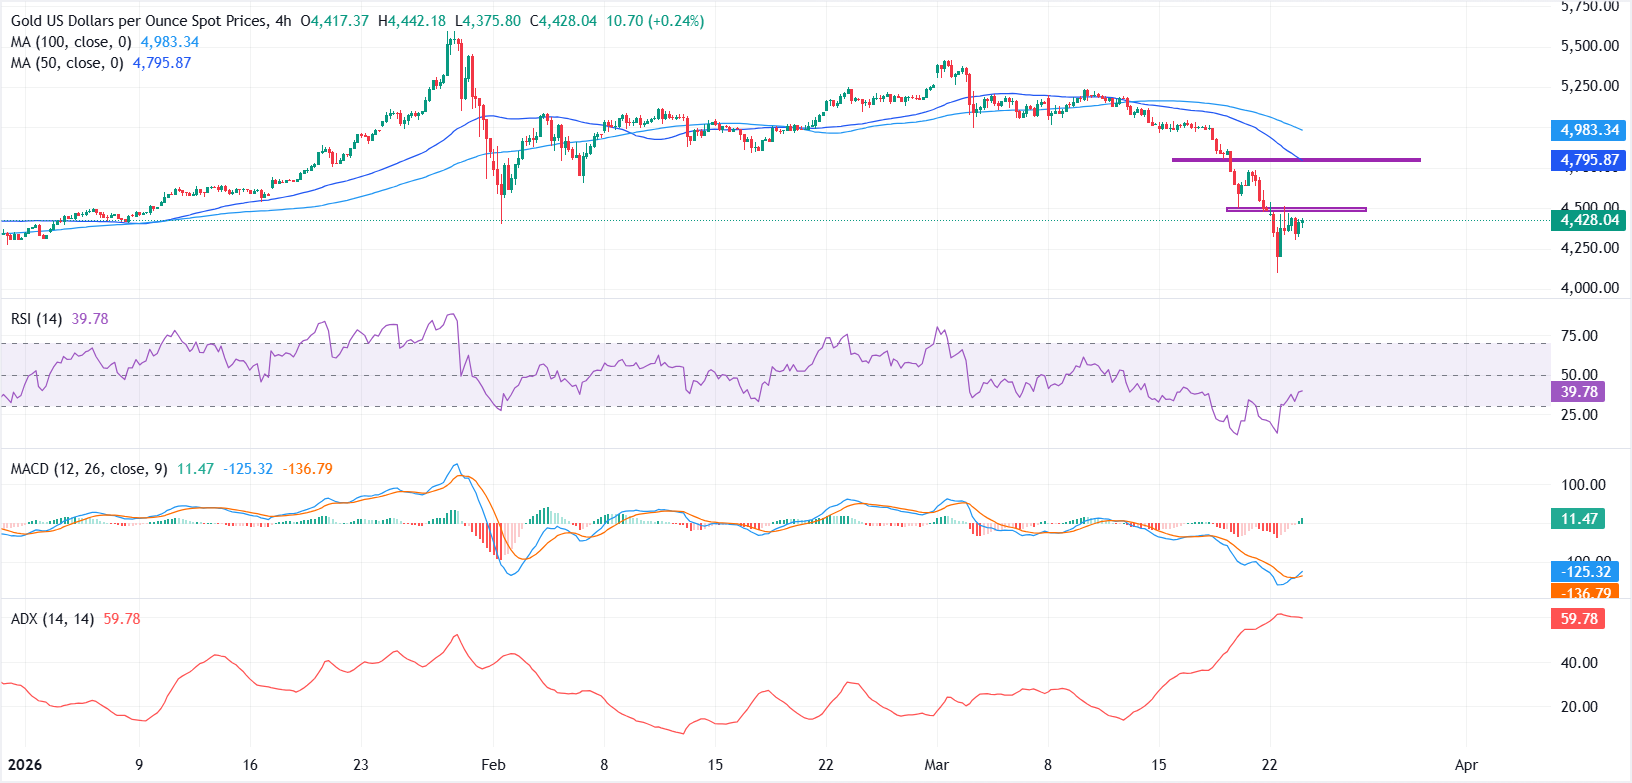
On the 4-hour chart, the near-term bias remains bearish as price continues to trade well below the declining 50- and 100-period Simple Moving Averages (SMAs), highlighting persistent selling pressure.
The Relative Strength Index (RSI) at 39 stays below the 50 midline, indicating sellers retain momentum despite a modest recovery from oversold conditions seen earlier in the sequence.
The Moving Average Convergence Divergence (MACD) indicator has turned higher from deeply negative levels, with the MACD line crossing above the signal line and the histogram flipping into positive territory, suggesting bearish momentum is fading but not yet reversing, leaving sellers with an advantage while a corrective bounce unfolds.
On the upside, immediate resistance is seen at the $4,450-$4,500 zone, with stronger barriers at the 50-day SMA near $4,795 and the 100-day SMA at $4,983, just below the $5,000 mark.
On the downside, $4,300 marks initial support, followed by $4,098, where dip buyers may step in, though a sustained move below this level could open the door for further downside.
US Dollar Price Today
The table below shows the percentage change of US Dollar (USD) against listed major currencies today. US Dollar was the strongest against the Australian Dollar.
| USD | EUR | GBP | JPY | CAD | AUD | NZD | CHF | |
|---|---|---|---|---|---|---|---|---|
| USD | 0.17% | 0.17% | 0.16% | 0.11% | 0.56% | 0.40% | 0.11% | |
| EUR | -0.17% | -0.02% | -0.02% | -0.06% | 0.38% | 0.22% | -0.06% | |
| GBP | -0.17% | 0.02% | 0.02% | -0.04% | 0.41% | 0.25% | -0.04% | |
| JPY | -0.16% | 0.02% | -0.02% | -0.04% | 0.40% | 0.24% | -0.04% | |
| CAD | -0.11% | 0.06% | 0.04% | 0.04% | 0.44% | 0.27% | -0.00% | |
| AUD | -0.56% | -0.38% | -0.41% | -0.40% | -0.44% | -0.16% | -0.47% | |
| NZD | -0.40% | -0.22% | -0.25% | -0.24% | -0.27% | 0.16% | -0.29% | |
| CHF | -0.11% | 0.06% | 0.04% | 0.04% | 0.00% | 0.47% | 0.29% |
The heat map shows percentage changes of major currencies against each other. The base currency is picked from the left column, while the quote currency is picked from the top row. For example, if you pick the US Dollar from the left column and move along the horizontal line to the Japanese Yen, the percentage change displayed in the box will represent USD (base)/JPY (quote).
Author

Vishal Chaturvedi
FXStreet
I am a macro-focused research analyst with over four years of experience covering forex and commodities market. I enjoy breaking down complex economic trends and turning them into clear, actionable insights that help traders stay ahead of the curve.


