Gold rises as Trump rejects Iran deal, war risks increase
- Trump weighs military action after rejecting Tehran’s ceasefire demands.
- WTI jumps as Hormuz risks revive inflation concerns.
- Traders await the US CPI and PPI for Fed clues.

Gold (XAU/USD) price advances modestly by 0.30% on Monday as the Iran-US conflict resolution stalls following Tehran’s proposal, which was disregarded by US President Donald Trump, who said that it was “totally unacceptable.” At the time of writing, XAU/USD trades at $4,726 after bouncing off daily lows of $4,648.
XAU/USD climbs as Iran tensions lift Oil and haven demand
Developments during the Asian and European sessions pushed Oil prices higher, yet bullion held to its gains, even though the Greenback is positive on the trading session.
Iran demanded compensation for war damage, the control of the Strait of Hormuz, unfreezing funds and ending the US Navy blockade. Tehran’s response omitted the delivery of nuclear stockpiles to the US, hugely demanded by Trump, who said that Iran cannot have a nuclear bomb.
Axios reported that Trump is meeting with its national security council, according to US officials who said that the President is evaluating the resumption of military action.
Fears of an escalation prompted traders to push US crude Oil prices up by 3.60%, with West Texas Intermediate (WTI) at $98.09 per barrel. The Greenback followed suit, as the US Dollar Index (DXY), which tracks the buck’s value against a basket of six currencies, is up 0.10% at 97.94.
Data-wise, Existing Home Sales in the US edged up 0.2% in April to a seasonally adjusted annual rate of 4.02 million, according to the National Association of Realtors. Traders' eyes are on US inflation data for April this week, with the Consumer Price Index (CPI) scheduled for Tuesday and the Producer Price Index (PPI) on Thursday.
Fed to hold rates unchanged in 2026
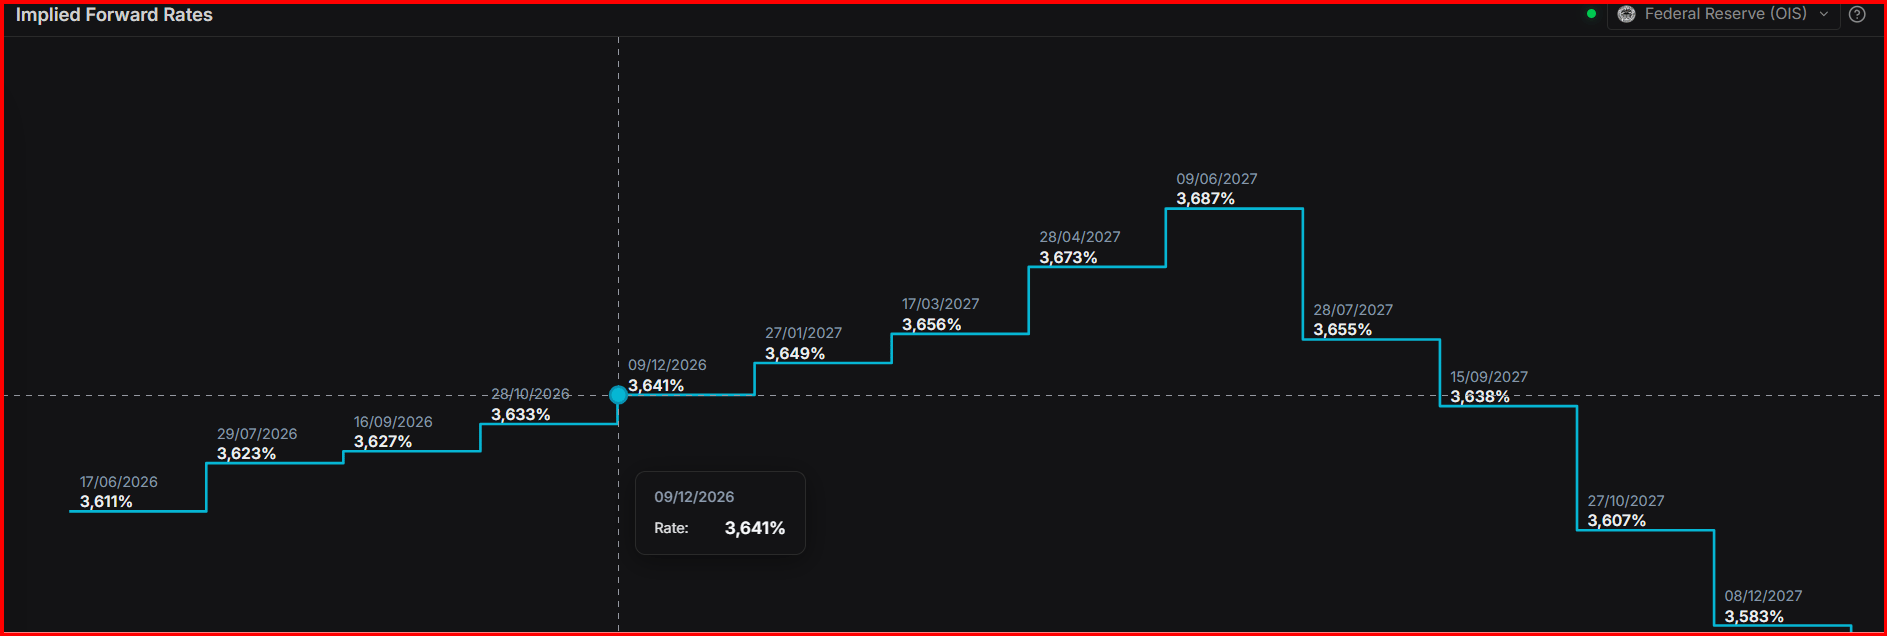
Meanwhile, Morgan Stanley’s Global Head of Macro Strategy, Matt Hornbach, said the bank does not expect the Federal Reserve to cut interest rates in 2026. Data from Prime Terminal shows that Morgan Stanley’s view aligns with money market participants, who expect the US central bank to remain on hold this year.
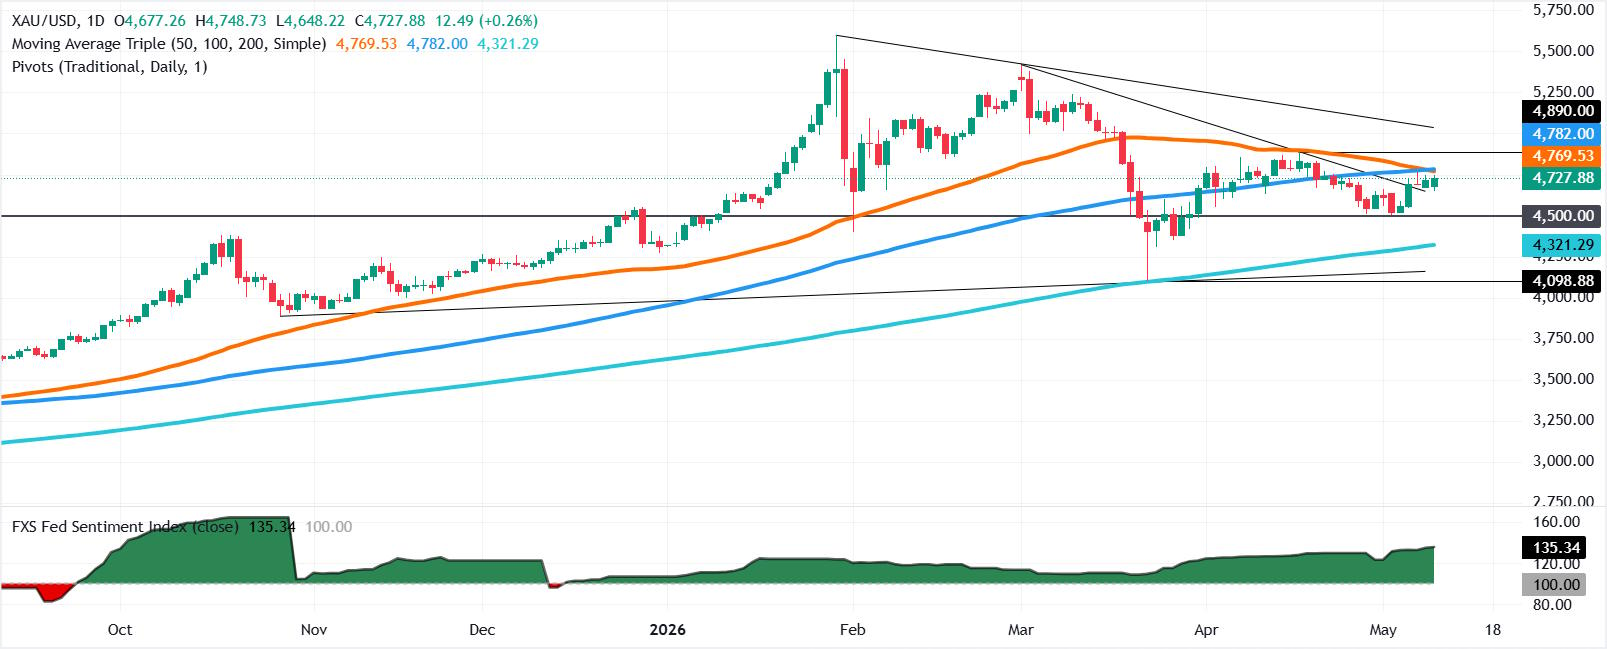
XAU/USD technical outlook: Gold to remain sideways, below $4,750
From a technical standpoint, Gold is poised to consolidate further, trapped between key technical resistance and support levels, as momentum remains flat, as depicted by the Relative Strength Index (RSI). The RSI, although bullish, is flatlined.
On the upside, XAU/USD must clear the 50-day Simple Moving Average (SMA) at $4,769. Once surpassed, the next stop would be the 100-day SMA at $4,772, ahead of the $4,800 milestone.
On the downside, Gold’s first support is the $4,700 psychological figure. A breach of the latter will expose the 20-day SMA at $4,694 ahead of challenging the May 4 swing low of $4,500.
Gold FAQs
Gold has played a key role in human’s history as it has been widely used as a store of value and medium of exchange. Currently, apart from its shine and usage for jewelry, the precious metal is widely seen as a safe-haven asset, meaning that it is considered a good investment during turbulent times. Gold is also widely seen as a hedge against inflation and against depreciating currencies as it doesn’t rely on any specific issuer or government.
Central banks are the biggest Gold holders. In their aim to support their currencies in turbulent times, central banks tend to diversify their reserves and buy Gold to improve the perceived strength of the economy and the currency. High Gold reserves can be a source of trust for a country’s solvency. Central banks added 1,136 tonnes of Gold worth around $70 billion to their reserves in 2022, according to data from the World Gold Council. This is the highest yearly purchase since records began. Central banks from emerging economies such as China, India and Turkey are quickly increasing their Gold reserves.
Gold has an inverse correlation with the US Dollar and US Treasuries, which are both major reserve and safe-haven assets. When the Dollar depreciates, Gold tends to rise, enabling investors and central banks to diversify their assets in turbulent times. Gold is also inversely correlated with risk assets. A rally in the stock market tends to weaken Gold price, while sell-offs in riskier markets tend to favor the precious metal.
The price can move due to a wide range of factors. Geopolitical instability or fears of a deep recession can quickly make Gold price escalate due to its safe-haven status. As a yield-less asset, Gold tends to rise with lower interest rates, while higher cost of money usually weighs down on the yellow metal. Still, most moves depend on how the US Dollar (USD) behaves as the asset is priced in dollars (XAU/USD). A strong Dollar tends to keep the price of Gold controlled, whereas a weaker Dollar is likely to push Gold prices up.
Author

Christian Borjon Valencia
FXStreet
Markets analyst, news editor, and trading instructor with over 14 years of experience across FX, commodities, US equity indices, and global macro markets.
















