Cooler inflation buys the Dow Jones Industrial Average nothing
- DJIA spikes to the 54,000 handle on the print, then hands it all back.
- Headline CPI 3.4% YoY and core 2.5%, both in line and both lower.
- CoreWeave up 18%, Super Micro Computer up 13%, neither inside the index.

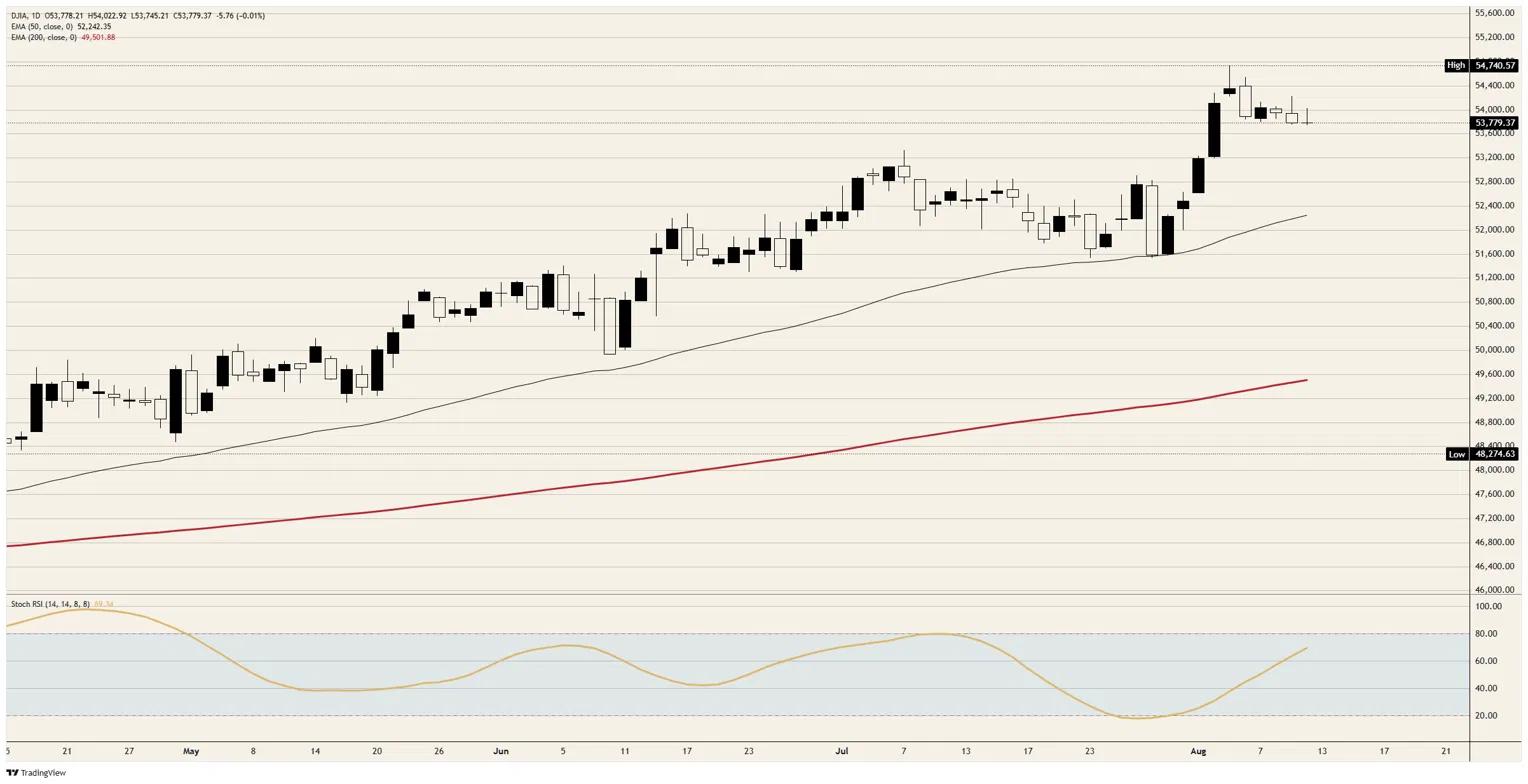
The July Consumer Price Index (CPI) landed at 12:30 GMT on every line the consensus had written for it, and the Dow Jones Industrial Average (DJIA) has spent the hours since handing back the few minutes of enthusiasm that followed. The index printed its session high at the 54,000 handle inside the release candle, faded a second attempt an hour later, and now trades a handful of points beneath yesterday's close near 53,800.
The scheduled catalyst decided nothing
Headline prices rose 0.1% on the month against a 0.1% consensus, reversing a 0.4% June decline and taking the annual rate to 3.4% from 3.5%. Core rose 0.2% for 2.5% on the year, a tenth softer than June and level with the forecast. The only figure on the page to miss was the unadjusted index, which came in seven hundredths of a point under its own consensus.
Rate futures took the print and moved, with the hold side of the September 16 meeting now priced near 58% against something close to an even split as recently as Monday. The tape did none of that work. An index pinned in a narrow band beneath its record for the past week was handed the one scheduled number capable of breaking that band, and it has travelled roughly 275 points to arrive back where it started.
The rally went to companies the index does not own
The S&P 500 added 0.2% and the Nasdaq Composite 0.5%, both carried by the artificial intelligence complex on two sets of results. CoreWeave (CRWV) rose 18% after doubling revenue from a year ago on a second-quarter operating margin above expectations, while Super Micro Computer (SMCI) added 13% on its fiscal first-quarter forecast, and Nebius (NBIS) gained 16%. Not one of the three is a component of the Dow Jones.
Inside the index, the same trade is represented by Cisco Systems (CSCO), up a little over 2%. Price weighting pays in Dollars of share price rather than percentage points of market value, at roughly six index points for every Dollar a component travels, so one of the lower-priced names on the roster gaining 2% is worth a handful of points. An 18% move outside the membership is worth precisely zero, which is why the broad averages are green and this one is not.
The barrel the print did not see
July's disinflation leaned on energy, which fell 1.5% on the month after a 5.7% June decline and still sits close to 15% higher on the year. Crude Oil has spent this week going the other way, holding above $83 for a fifth consecutive session while the Strait of Hormuz stays shut and the Oman channel produces demands rather than a document.
Today's Energy Information Administration (EIA) figures showed a build of more than 17.4 million barrels against expectations for a small draw, and Crude Oil kept its bid regardless. A barrel that shrugs off an inventory surge of that size is pricing the blockade rather than the balance sheet, and transit through the Strait ran to 14 vessels on Tuesday against a ten-day average nearer eleven. The three regional Fed Reserve (Fed) presidents who dissented for a quarter point in July were reading that barrel, not this morning's release, and the next print covers a month in which the energy line stops helping.
What the rest of the week prints
Thursday brings the Producer Price Index (PPI) at 12:30 GMT, headline expected at 0.2% on the month against a 0.3% June decline and 4.9% on the year from 5.5%, with the core annual rate seen at 4.2% from 4.7%. Initial claims are forecast at 202K from 199K. One of July's three dissenters speaks at 12:15 GMT and a second regional president at 12:40, and the long end takes down a 30-year auction that afternoon against a previous award above 5%.
Friday carries Retail Sales at 12:30 GMT, expected at 0.1% on the month from 0.2%, with the ex-autos line at 0.2% against a 0.2% decline. Michigan sentiment follows at 14:00 GMT at 54.5 against 55.2, and the survey's one-year inflation expectation was last at 4.2%. Neither release moves the September meeting on its own, but the pair frames whether a consumer paying up for fuel is still spending.
Levels to watch
Resistance: The 54,000 handle turned back two attempts inside the session and is the first line the index has to recover, with the record just short of 54,750 sitting nearly 2% above spot.
Support: The 53,800 area that floored the past week has gone with spot beneath it, leaving 53,500 as the first defence and the 53,000 handle beneath that, where the run to the record began. The 50-day Exponential Moving Average (EMA) near 52,250 is the deeper reference and sits a long way below.
Bias: Bearish beneath 53,800. An index that spikes to 54,000 on the friendliest print available, gives all of it back and then trades under the floor it defended for a week is distributing rather than consolidating. Objectives 53,500 then the 53,000 handle, with invalidation on a daily close back above 54,000.
Dow Jones daily chart
Dow Jones FAQs
The Dow Jones Industrial Average, one of the oldest stock market indices in the world, is compiled of the 30 most traded stocks in the US. The index is price-weighted rather than weighted by capitalization. It is calculated by summing the prices of the constituent stocks and dividing them by a factor, currently 0.152. The index was founded by Charles Dow, who also founded the Wall Street Journal. In later years it has been criticized for not being broadly representative enough because it only tracks 30 conglomerates, unlike broader indices such as the S&P 500.
Many different factors drive the Dow Jones Industrial Average (DJIA). The aggregate performance of the component companies revealed in quarterly company earnings reports is the main one. US and global macroeconomic data also contributes as it impacts on investor sentiment. The level of interest rates, set by the Federal Reserve (Fed), also influences the DJIA as it affects the cost of credit, on which many corporations are heavily reliant. Therefore, inflation can be a major driver as well as other metrics which impact the Fed decisions.
Dow Theory is a method for identifying the primary trend of the stock market developed by Charles Dow. A key step is to compare the direction of the Dow Jones Industrial Average (DJIA) and the Dow Jones Transportation Average (DJTA) and only follow trends where both are moving in the same direction. Volume is a confirmatory criteria. The theory uses elements of peak and trough analysis. Dow’s theory posits three trend phases: accumulation, when smart money starts buying or selling; public participation, when the wider public joins in; and distribution, when the smart money exits.
There are a number of ways to trade the DJIA. One is to use ETFs which allow investors to trade the DJIA as a single security, rather than having to buy shares in all 30 constituent companies. A leading example is the SPDR Dow Jones Industrial Average ETF (DIA). DJIA futures contracts enable traders to speculate on the future value of the index and Options provide the right, but not the obligation, to buy or sell the index at a predetermined price in the future. Mutual funds enable investors to buy a share of a diversified portfolio of DJIA stocks thus providing exposure to the overall index.
Author

Joshua Gibson
FXStreet
Joshua joins the FXStreet team as an Economics and Finance double major from Vancouver Island University with twelve years' experience as an independent trader focusing on technical analysis.















