Gold retreats further from $2,620 following upbeat US data
- Gold retreats further with the US Dollar supported by solid US data.
- US GDP and Jobless claims endorse the Fed's rhetoric of US economic exceptionalism.
- XAU/USD maintains its bearish bias intact, with upside attempts capped at a previous support area

Gold (XAU/USD) recovery has been short-lived. The pair failed to overcome the previous support area at $2,625, and extended its pullback on Thursday's early US session,. US Gross Domestic Product (GDP) and Jobless Claims figures have confirmed the robust economic picture portrayed by the Federal Reserve (Fed) on Wednesday, providing additional support to the Greenback.
On Wednesday the Fed cut rates as expected but raised its growth and inflation expectations and scaled down the interest rate cut projections for next year. This, coupled with an unusually hawkish tone from Fed Chairman Jerome Powell, triggered a risk-averse reaction, sending the US Dollar Index (DXY), which tracks the USD value against six major currencies, to test two-year highs and crushing Gold and equities.
Higher US yields and a strong USD are likely to limit Gold’s recovery
- Data released on Wednesday revealed that the US economy grew at a 3.1% annualized pace in the third quarter, a significant improvement from the already healthy, 2.8% advance previously estimated.
- Likewise, Weekly Jobless Claims declined to 220K on the week of November 13, from the previous week's 242K beating expectations of a slower decline to 230K
- On Wednesday, the Federal Reserve cut rates by 25 basis points (bps) to the 4.25%-4.50% range as expected. However, policymakers slashed their easing projections to just two rate cuts in 2025 from the four cuts estimated in September.
- Next year’s Personal Consumption Expenditures (PCE) inflation expectations were increased to 2.5% from 2.1% in September. Chairman Powell suggested that some officials considered the impact of Trump’s policy expectations on their inflation projections.
- US economic growth expectations were revised to 2.5% this year and 2.1% in 2025, from previous estimations of steady 2.0% GDP growth in both years.
- The labour market is also expected to be more resilient. The unemployment rate is expected to be 4.2% this year and 4.3% next year, down from the 4.4% previously foreseen for those two years.
- The central bank’s projections and an unusually hawkish tone from Fed Chairman Jerome Powell sent US Treasury yields rallying. The benchmark 10-year yield has reached levels above 4.5% after rallying about 40 basis points from last week’s lows.
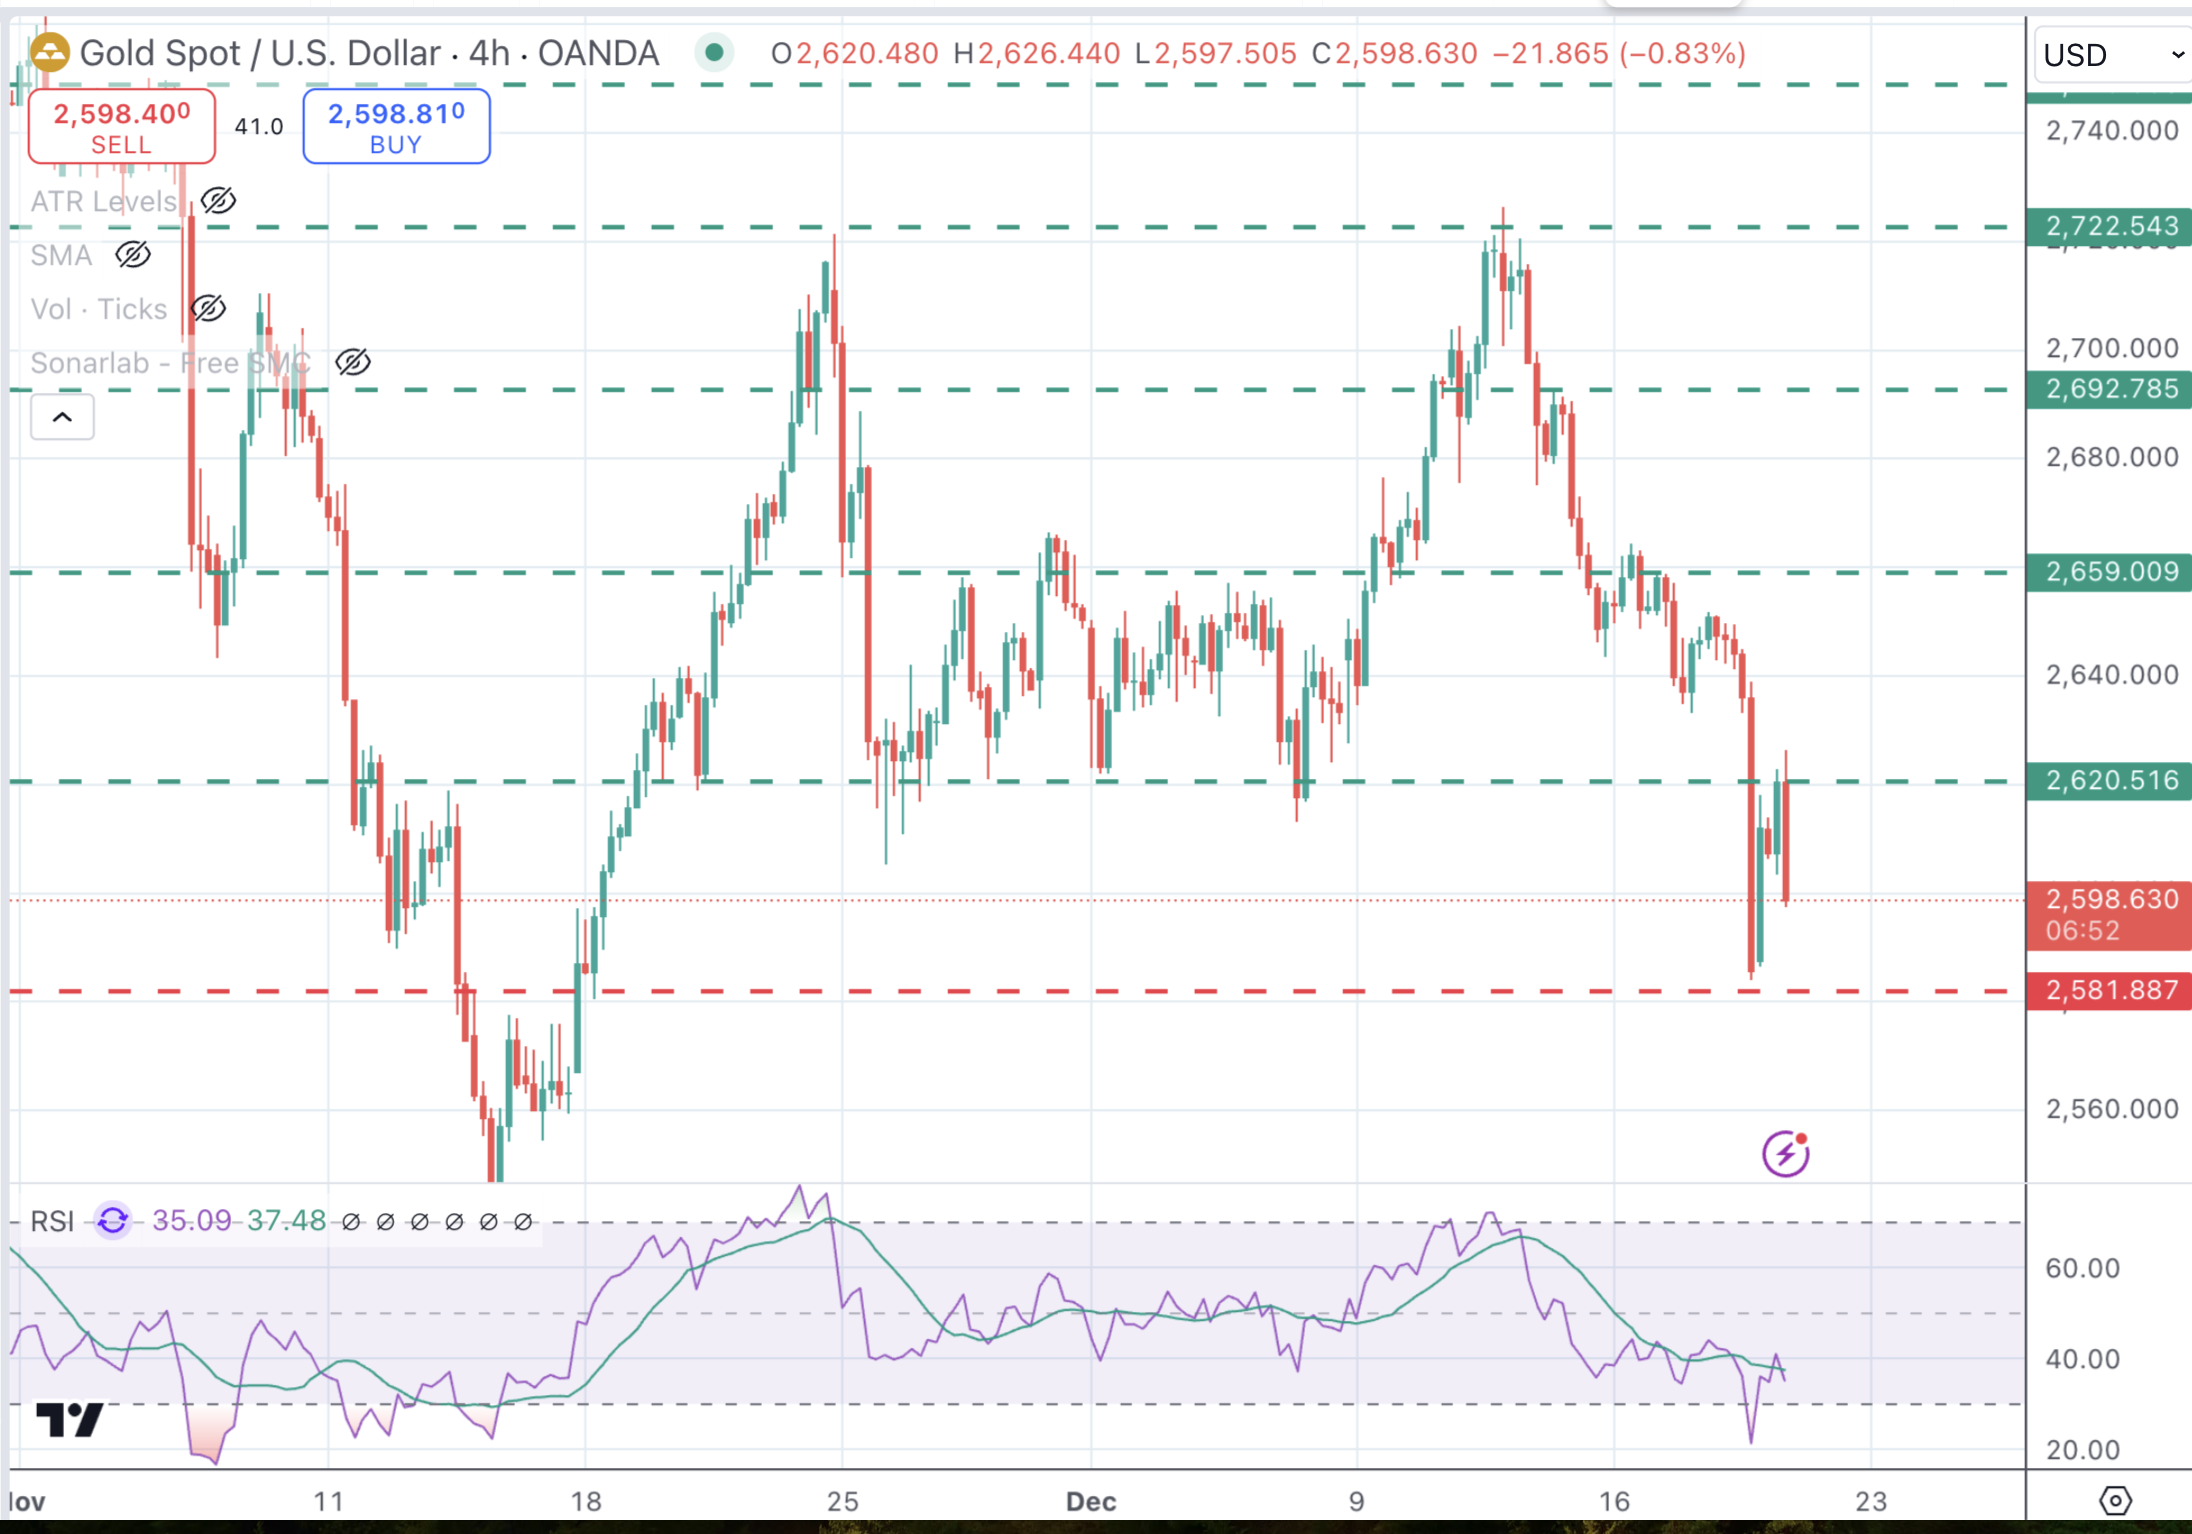
Technical analysis: XAU/USD remains capped below previous support at $2,625
Gold has failed to breach resistance at $2,630, which highlights the near-term trend of lower highs and lower lows. The impulsive bearish candle in the daily chart printed on Wednesday has confirmed the negative giving bears hopes of extending below Wednesday’s low of $2,580, ahead of November’s trough at $2,540.
On the upside, the pair should overcome the previous support, now turned resistance at the $2,625-$2,630 area (November 28, December 2 lows). and tthe December 17 high at $2,650 to ease bearish pressure.
XAU/USD 4-hour Chart
Dot Plot FAQs
The “Dot Plot” is the popular name of the interest-rate projections by the Federal Open Market Committee (FOMC) of the US Federal Reserve (Fed), which implements monetary policy. These are published in the Summary of Economic Projections, a report in which FOMC members also release their individual projections on economic growth, the unemployment rate and inflation for the current year and the next few ones. The document consists of a chart plotting interest-rate projections, with each FOMC member’s forecast represented by a dot. The Fed also adds a table summarizing the range of forecasts and the median for each indicator. This makes it easier for market participants to see how policymakers expect the US economy to perform in the near, medium and long term.
The US Federal Reserve publishes the “Dot Plot” once every other meeting, or in four of the eight yearly scheduled meetings. The Summary of Economic Projections report is published along with the monetary policy decision.
The “Dot Plot” gives a comprehensive insight into the expectations from Federal Reserve (Fed) policymakers. As projections reflect each official’s projection for interest rates at the end of each year, it is considered a key forward-looking indicator. By looking at the “Dot Plot” and comparing the data to current interest-rate levels, market participants can see where policymakers expect rates to head to and the overall direction of monetary policy. As projections are released quarterly, the “Dot Plot” is widely used as a guide to figure out the terminal rate and the possible timing of a policy pivot.
The most market-moving data in the “Dot Plot” is the projection of the federal funds rate. Any change compared with previous projections is likely to influence the US Dollar (USD) valuation. Generally, if the “Dot Plot” shows that policymakers expect higher interest rates in the near term, this tends to be bullish for USD. Likewise, if projections point to lower rates ahead, the USD is likely to weaken.
Author

Guillermo Alcala
FXStreet
Graduated in Communication Sciences at the Universidad del Pais Vasco and Universiteit van Amsterdam, Guillermo has been working as financial news editor and copywriter in diverse Forex-related firms, like FXStreet and Kantox.


