Gold Price Forecast: XAUUSD wavers in range around $1,850, levels to watch – Confluence Detector
- Gold Price is struggling around the $1,850 area amid risk-off markets.
- Record high inflation rate in the Euro area re-ignites growth concerns.
- USD holds the bounce with yields, XAUUSD’s range play likely to extend.

Gold Price is adding to the previous losses while keeping its range around the $1,850 psychological level. The precious metal feels the heat from a broad US dollar rebound amid a sharp upturn in the Treasury yields. Markets remain in a risk-off mode, underpinning the dollar’s haven demand. The ongoing upsurge in oil prices and record-high inflation in the Euro area have re-ignited global growth worries, as central banks remain on a tightening spree. Against this backdrop, gold price is finding some comfort, limiting its move lower. Traders now look forward to the US Nonfarm payrolls release for a fresh direction in XAUUSD.
Also read: Gold Price Forecast: XAUUSD looks south amid firmer yields, 200-DMA at risk?
Gold Price: Key levels to watch
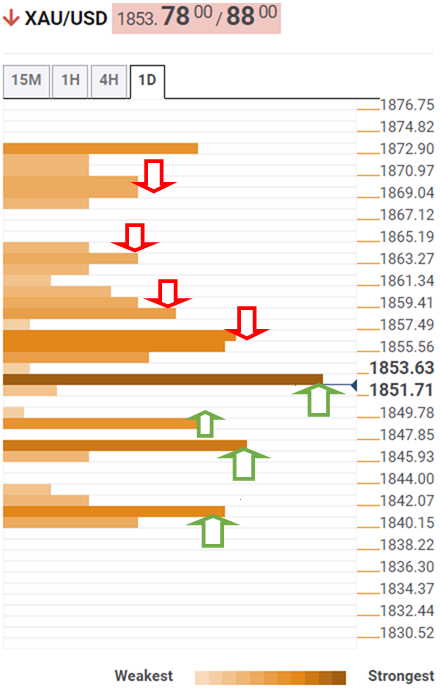
The Technical Confluences Detector shows that the Gold Price is gyrating around the $1,851 critical barrier, which is now acting as strong support. That price is the convergence of the Fibonacci 61.8% one-week, SMA50 four-hour and the pivot point one-day S1.
If that breaks then the next safety net appears at the pivot point one-day S2 at $1,848.
Further south, the pivot point one-month S1 at $1,846 will challenge the bullish commitments.
The last line of defense for gold bulls is seen at $1,841, the confluence of the SMA200 one-day, the previous week’s low and the pivot point one-week S3.
On the upside, bulls need a firm break above the $1,856 supply zone, where the SMA5 one-day, Fibonacci 23.6% one-day and the previous high four-hour collide.
The next bullish target is aligned at $1,859, the Fibonacci 38.2% one-day and one-week.
The Fibonacci 23.6% one-week at $1,863 will guard the additional upside, opening doors for a test of the previous week’s high of $1,870.
Here is how it looks on the tool
About Technical Confluences Detector
The TCD (Technical Confluences Detector) is a tool to locate and point out those price levels where there is a congestion of indicators, moving averages, Fibonacci levels, Pivot Points, etc. If you are a short-term trader, you will find entry points for counter-trend strategies and hunt a few points at a time. If you are a medium-to-long-term trader, this tool will allow you to know in advance the price levels where a medium-to-long-term trend may stop and rest, where to unwind positions, or where to increase your position size.
Author

Dhwani Mehta
FXStreet
Residing in Mumbai (India), Dhwani is a Senior Analyst and Manager of the Asian session at FXStreet. She has over 10 years of experience in analyzing and covering the global financial markets, with specialization in Forex and commodities markets.
















