Gold Price Forecast: XAUUSD range play to extend around $1,850 ahead of US inflation – Confluence Detector
- Gold Price is reversing the previous rebound amid risk-off markets.
- The US dollar gains amid risk-aversion and rebounding Treasury yields.
- Global growth concerns to put a floor under XAUUSD, as US inflation is awaited.

Gold Price is reversing a part of the previous recovery gains, in light of a notable US dollar demand alongside rebounding Treasury yields. The dollar capitalizes on the risk-off flows, courtesy of global recession fears, as central banks tighten monetary policy to fight inflation. On the other side, rising inflation expectations boost yields across the curve, adding to the weight on the non-yielding gold. Although XAU bulls manage to find some support from the bleak outlook for the global economy, following the GDP downgrades by the World Bank and the OECD. Traders remain focussed on Friday’s US inflation data for a fresh direction in XAUUSD.
Also read: Gold Price Forecast: Bull-bear tug-of-war around $1,850 extends, all eyes on US inflation
Gold Price: Key levels to watch
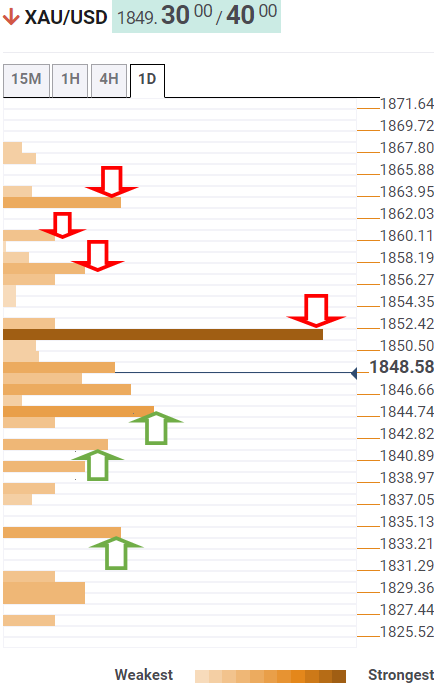
The Technical Confluence Detector shows that it is critical for Gold Price to scale the $1,852 hurdle to initiate any meaningful recovery. That level is the intersection of the SMA10 one-day, Fibonacci 23.6% one-day and SMA50 four-hour.
The next bullish target is aligned at the Fibonacci 61.8% one-week at $1,857, above which the pivot point one-day R1 at $1,860 could be challenged.
Strong support of the Fibonacci 61.8% one-month at $1,863 will be a tough nut to crack for XAU bulls.
On the flip side, the Fibonacci 61.8% one-day at $1,844 could emerge as a fierce cushion.
A sustained move below the latter will expose the $1,842-$1,840 demand area, where the SMA200 one-day, Fibonacci 23.6% one-week and pivot point one-day S1 coincide.
The previous day’s low of $1,837 will test the bullish commitments, as sellers will aim for the Fibonacci 38.2% one-month at $1,835.
Here is how it looks on the tool
About Technical Confluences Detector
The TCD (Technical Confluences Detector) is a tool to locate and point out those price levels where there is a congestion of indicators, moving averages, Fibonacci levels, Pivot Points, etc. If you are a short-term trader, you will find entry points for counter-trend strategies and hunt a few points at a time. If you are a medium-to-long-term trader, this tool will allow you to know in advance the price levels where a medium-to-long-term trend may stop and rest, where to unwind positions, or where to increase your position size.
Author

Dhwani Mehta
FXStreet
Residing in Mumbai (India), Dhwani is a Senior Analyst and Manager of the Asian session at FXStreet. She has over 10 years of experience in analyzing and covering the global financial markets, with specialization in Forex and commodities markets.

















