Gold Price Forecast: XAUUSD path of least resistance appears down – Confluence Detector
- Gold price gathers strength to retest 11-month troughs below $1,700.
- US dollar stalls correction as risk sentiment turns cautious ahead ECB, BOJ.
- XAUUSD faces a wall of resistance despite falling Treasury yields.

Gold price continues to mire in yearly troughs so far this week, lacking a clear directional bias amid repricing of the Fed rate hike expectations. Investors also refrain from placing any aggressive bets on the bright metal ahead of the ECB and BOJ monetary policy announcements. The BOJ is widely expected to stick to its ultra-loose monetary policy while the ECB may surprise markets with a 50 bps rate hike. More hawkish than expected ECB could weigh negatively on the non-interest-bearing gold price. Meanwhile, the lack of first-tier US macro data combined with the Fed’s ‘blackout’ period leaves the metal traders in search of a significant catalyst. Meanwhile, the XAUUSD price will remain at the mercy of risk trends, with the US earnings season underway.
Also read: Gold Price Forecast: XAUUSD remains stuck in a range above $1,700, bearish potential intact
Gold Price: Key levels to watch
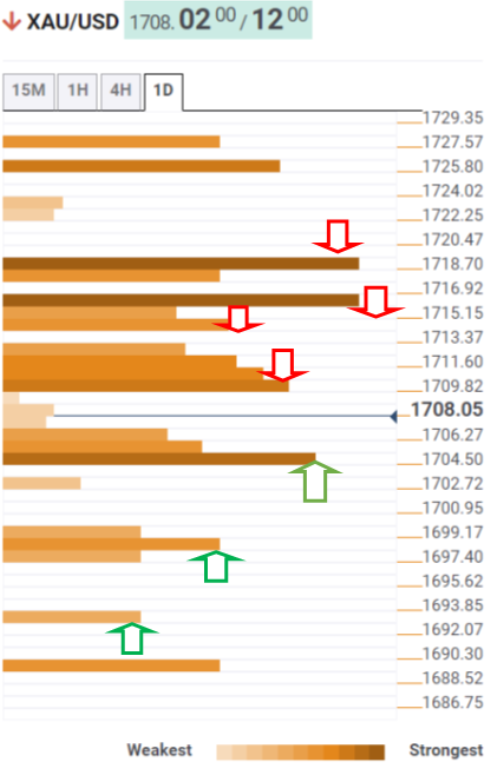
The Technical Confluence Detector shows that the downside appears more compelling for Gold price, as it faces a wall of resistance should any recovery momentum pick up steam.
A dense cluster of healthy resistance levels is stacked up around $1,711, where the SMA10 four-hour, Fibonacci 61.8% one-day and Bollinger Band four-hour Middle coincide.
The next hurdle is seen at the Fibonacci 38.2% one-day at $1,714, above which bulls will need vigor to take out the confluence of the Fibonacci 23.6% one-day and 38.2% one-week at $1,716.
The previous day’s high of $1,719 will be the level to beat for XAU bulls.
Alternatively, strong support awaits at $1,704, which is the convergence of the pivot point one-day S1 and pivot point one-month S3.
The next relevant downside target is aligned at the previous week’s low of $1,698.
Further south, the pivot point one-day S3 at $1,693 will come to the rescue of gold buyers.
Here is how it looks on the tool
About Technical Confluences Detector
The TCD (Technical Confluences Detector) is a tool to locate and point out those price levels where there is a congestion of indicators, moving averages, Fibonacci levels, Pivot Points, etc. If you are a short-term trader, you will find entry points for counter-trend strategies and hunt a few points at a time. If you are a medium-to-long-term trader, this tool will allow you to know in advance the price levels where a medium-to-long-term trend may stop and rest, where to unwind positions, or where to increase your position size.
Author

Dhwani Mehta
FXStreet
Residing in Mumbai (India), Dhwani is a Senior Analyst and Manager of the Asian session at FXStreet. She has over 10 years of experience in analyzing and covering the global financial markets, with specialization in Forex and commodities markets.

















