Gold Price Forecast: XAUUSD keeps sight on $1,683 whilst above $1,660 – Confluence Detector
- Gold price is pausing its corrective downside as subdued US Treasury yields lend support.
- The US Dollar rebounds firmly amid a cautious market mood on Mid-term Elections Day.
- XAU/USD bulls remain hopeful amid powerful support aligned at $1,660.

Gold price has paused its corrective decline from a three-week peak of $1,683, as a subdued performance in the US Treasury yields has come to the rescue of buyers. The previous metal has once again found some support near the $1,665 region, as investors stay on the sidelines on the US Mid-term Election Day. Uncertainty over the US Federal Reserve’s (Fed) next rate hike move, ahead of Thursday’s critical Consumer Price Index (CPI) from the United States, keep the US Dollar strength limited, aiding Gold’s rebound. Markets are currently pricing a 55% probability of a 50 bps December Fed rate hike. Meanwhile, rising covid-related concerns in China and their impact on economic growth sap investors’ confidence. The outcome of the US Mid-term Elections could also have a temporary impact on the market sentiment, eventually affecting the US Dollar and Gold price.
Also read: Gold Price Forecast: XAUUSD clings to 50DMA before the next push higher toward $1,700
Gold Price: Key levels to watch
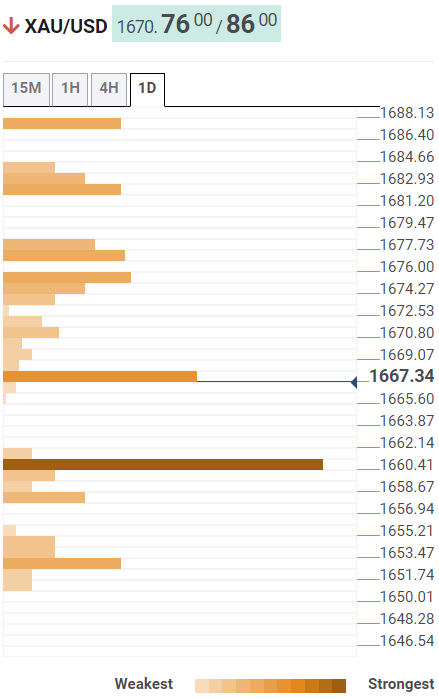
The Technical Confluence Detector shows that the gold price is looking to recapture strong resistance at around $1,675 on its renewed upswing.
That level is the convergence of the SMA50 one-day and SMA10 four-hour. The previous year’s low at $1,677 will be next on buyers’ radars.
Further up, the previous week’s high at $1,683 will come into play.
Alternatively, a sustained break below the previous day’s low of $1,667 will reinforce a fresh downside momentum. At that point, the pivot point one-day S1 and the Fibonacci 23.6% one-week also meet.
Should the selling pressure intensify, then a fresh drop towards the confluence of the Fibonacci 38.2% one-month and pivot point one-day S2 at $1,660 cannot be ruled out.
Here is how it looks on the tool
About Technical Confluences Detector
The TCD (Technical Confluences Detector) is a tool to locate and point out those price levels where there is a congestion of indicators, moving averages, Fibonacci levels, Pivot Points, etc. If you are a short-term trader, you will find entry points for counter-trend strategies and hunt a few points at a time. If you are a medium-to-long-term trader, this tool will allow you to know in advance the price levels where a medium-to-long-term trend may stop and rest, where to unwind positions, or where to increase your position size.
Author

Dhwani Mehta
FXStreet
Residing in Mumbai (India), Dhwani is a Senior Analyst and Manager of the Asian session at FXStreet. She has over 10 years of experience in analyzing and covering the global financial markets, with specialization in Forex and commodities markets.

















