Gold Price Forecast: XAU/USD looks north towards $1,837 ahead of US inflation – Confluence Detector
- Gold price pauses as bulls take a breather ahead of US inflation data.
- Treasury yields and risk sentiment remain the key drivers impacting gold price.
- Gold has room to rise amid inflation fears and bull cross.

Gold price is treading water on Wednesday while sitting at the highest levels in roughly two weeks near $1,830. The pullback in the US Treasury yields from two-and-a-half year highs fuelled a drop in the dollar across its main peers, limiting the retreat in gold price. Further upside, however, remains capped by the risk-on market mood, thanks to the Wall Street tech boost.
In absence of significant US macro data, the gold price will continue to track yields, as investors keep an eye on the Russia-Ukraine geopolitical developments. Cleveland Fed Chief Loretta Mester’s speech and an auction of 10-year Treasuries will be awaited as well for any fresh impulse on gold trading but the reaction could be limited ahead of Thursday’s all-important US inflation data,
Read: Gold prices surge ahead of key inflation data – What’s next?
Gold Price: Key levels to watch
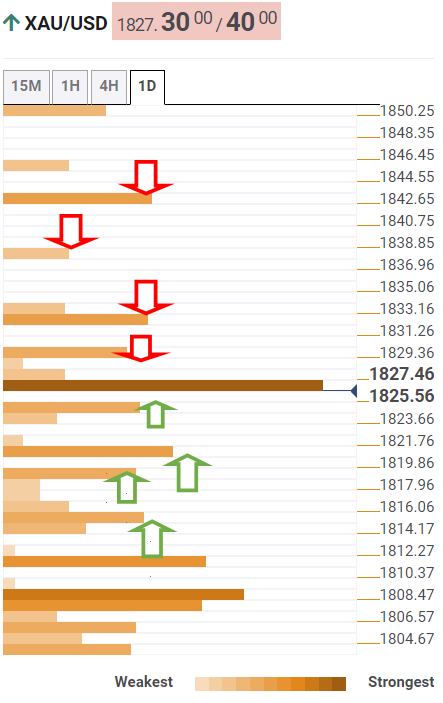
The Technical Confluences Detector shows that the gold price is yearning for acceptance above powerful resistance at $1,826, which is the convergence of the Fibonacci 23.6% one-day, Fibonacci 61.8% one-month and 5-4hr SMA.
The next bullish target is at the previous day’s high of $1,829, above which fresh buying opportunities will emerge towards $1,832, the confluence of the daily R1 pivot point and weekly R2 pivot point.
Further up, the daily R2 pivot point at $1,837 will challenge bearish commitments en-route to $1,843, where the monhtly R1 pivot point aligns.
On the flip side, immediate support is seen at the daily 38.2% Fibonacci retracement at $1,824, below which sellers will gear up for a test of $1,820.
That level is the point of intersection of the daily 61.8% Fibonacci and the weekly R1 pivot point.
The additional declines will seek a test of a dense cluster of healthy support levels around $1,815, where the 200-4hr SMA, the previous week’s high and 5-day SMA coincide.
Here is how it looks on the tool
About Technical Confluences Detector
The TCD (Technical Confluences Detector) is a tool to locate and point out those price levels where there is a congestion of indicators, moving averages, Fibonacci levels, Pivot Points, etc. If you are a short-term trader, you will find entry points for counter-trend strategies and hunt a few points at a time. If you are a medium-to-long-term trader, this tool will allow you to know in advance the price levels where a medium-to-long-term trend may stop and rest, where to unwind positions, or where to increase your position size.
Author

Dhwani Mehta
FXStreet
Residing in Mumbai (India), Dhwani is a Senior Analyst and Manager of the Asian session at FXStreet. She has over 10 years of experience in analyzing and covering the global financial markets, with specialization in Forex and commodities markets.


