|

Gold Price Forecast: XAU/USD gets rejected by the 200-day SMA, US yields rise

  • XAU/USD consolidated Friday’s gains and found strong resistance at the 200-day SMA around $1,930.
  • US Treasury yields continue to rise and weigh on the precious metal.
  • Geopolitical tensions in the Middle East may limit the downside potential.

At the beginning of the week, the XAU/USD retreated towards $1,920 and consolidated Friday’s rally, which saw the spot price rising by more than 3%. 

Markets will remain quiet on Monday, and investors await Tuesday’s Retail Sales figures from the US from September to continue placing their bets on the Federal Reserve's (Fed) next decisions. As for now, US Treasury yields are rising and may suggest that markets are gearing up for one more hike by the Fed in 2023, and as long as hawkish bets remain elevated, the yellow metal may have difficulty finding demand. The 2, 5 and 10-year yields rose to 5.08% and 4.70%, with all three seeing more than 0.50% increases.

On the positive side, tensions escalate in the conflict between Israel and Hamas, and the precious metal may benefit from market participants seeking refuge in safe-haven assets. 

XAU/USD Levels to watch 

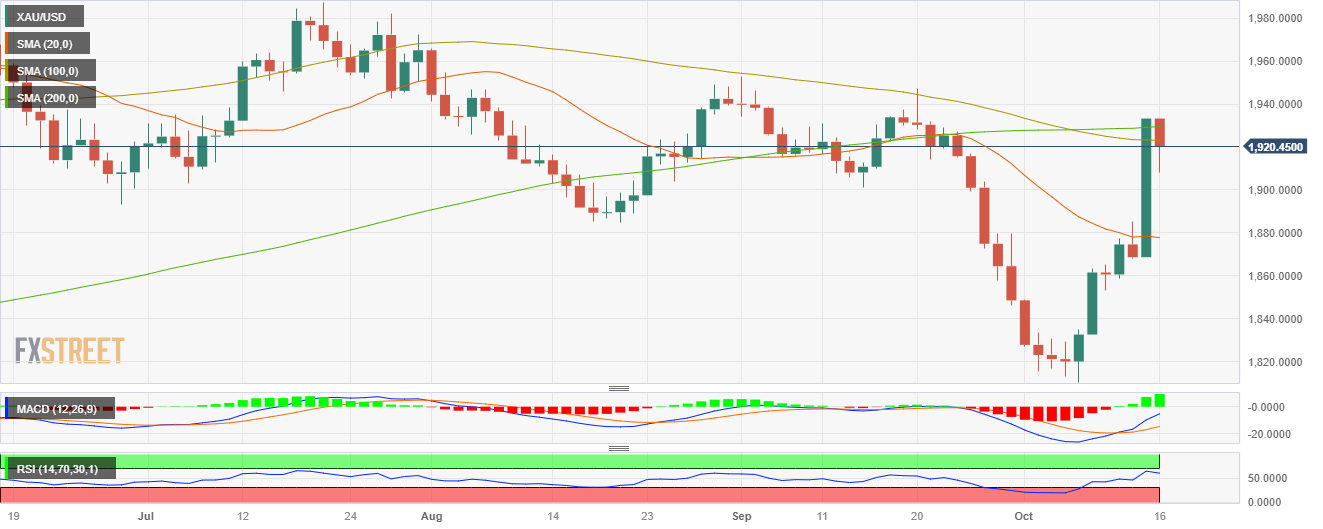
Considering the daily chart, XAU/USD presents a neutral to bullish outlook, with the bulls gaining significant ground last week. Despite pointing south, the Relative Strength Index (RSI) jumped to positive territory on Friday, while the Moving Average Convergence (MACD) histogram prints larger green bars. In the larger context, the price got rejected by the 200-day Simple Moving Average (SMA) at $1,930 but managed to close above the 20 and 100-day Averages, indicating that the overall trend is favouring the buyers.

 Support levels: $1,910, $1,900, $1,880.

 Resistance levels: $1,930 (200-day SMA), $1,950, $1,970.

XAU/USD Daily Chart

XAU/USD

Overview
Today last price1921.57
Today Daily Change-11.67
Today Daily Change %-0.60
Today daily open1933.24
 
Trends
Daily SMA201878.44
Daily SMA501901.39
Daily SMA1001923.28
Daily SMA2001929.19
 
Levels
Previous Daily High1933.34
Previous Daily Low1868.66
Previous Weekly High1933.34
Previous Weekly Low1832.62
Previous Monthly High1953.01
Previous Monthly Low1846.37
Daily Fibonacci 38.2%1908.63
Daily Fibonacci 61.8%1893.37
Daily Pivot Point S11890.15
Daily Pivot Point S21847.07
Daily Pivot Point S31825.47
Daily Pivot Point R11954.83
Daily Pivot Point R21976.43
Daily Pivot Point R32019.51

Author

Patricio Martín

Patricio is an economist from Argentina passionate about global finance and understanding the daily movements of the markets.

More from Patricio Martín
Share:

Markets move fast. We move first.

Orange Juice Newsletter brings you expert driven insights - not headlines. Every day on your inbox.

By subscribing you agree to our Terms and conditions.

Editor's Picks

EUR/USD moves sideways below 1.1800 on Christmas Eve

EUR/USD struggles to find direction and trades in a narrow channel below 1.1800 after posting gains for two consecutive days. Bond and stock markets in the US will open at the usual time and close early on Christmas Eve, allowing the trading action to remain subdued. 

GBP/USD keeps range around 1.3500 amid quiet markets

GBP/USD keeps its range trade intact at around 1.3500 on Wednesday. The Pound Sterling holds the upper hand over the US Dollar amid pre-Christmas light trading as traders move to the sidelines heading into the holiday season. 

Gold retreats from record highs, trades below $4,500

Gold retreats after setting a new record-high above $4,520 earlier in the day and trades in a tight range below $4,500 as trading volumes thin out ahead of the Christmas break. The US Dollar selling bias remains unabated on the back of dovish Fed expectations, which continues to act as a tailwind for the bullion amid persistent geopolitical risks.

Bitcoin slips below $87,000 as ETF outflows intensify, whale participation declines

Bitcoin price continues to trade around $86,770 on Wednesday, after failing to break above the $90,000 resistance. US-listed spot ETFs record an outflow of $188.64 million on Tuesday, marking the fourth consecutive day of withdrawals.

Economic outlook 2026-2027 in advanced countries: Solidity test

After a year marked by global economic resilience and ending on a note of optimism, 2026 looks promising and could be a year of solid economic performance. In our baseline scenario, we expect most of the supportive factors at work in 2025 to continue to play a role in 2026.

Avalanche struggles near $12 as Grayscale files updated form for ETF

Avalanche trades close to $12 by press time on Wednesday, extending the nearly 2% drop from the previous day. Grayscale filed an updated form to convert its Avalanche-focused Trust into an ETF with the US Securities and Exchange Commission.