Gold Price Forecast: XAU/USD could drop towards $1,651, with eyes on Fed – Confluence Detector
- Gold price is licking its wounds after Thursday’s over $30 meltdown.
- The US dollar, yields rally capitalize on big Fed rate hike expectations.
- XAU/USD’s path of least resistance appears down, with eyes on $1,758 and $1,751.

Gold price remains vulnerable amid the hawkish Fed narrative, with hefty rate hikes on the cards in the coming months. Hotter than expected US inflation combined with an unexpected rebound in Retail Sales have convinced markets that higher rates are likely to remain longer, propping up the US dollar alongside the Treasury yields. Rates on the US government bonds across the time horizon remain at multi-month highs, boding ill for the non-yielding gold. Further, India announced a cut in its base import price for gold along with a few other commodities, which renders negative for the metal while China's demand concerns still persist, despite an unexpected growth in the country’s economic activity. Looking ahead, gold bulls could seek a temporary reprieve from the position readjustment ahead of next week’s Fed decision. The end-of-the-week flows could also come into play./
Also read: Gold Price Forecast: Pre-FOMC adjustments could trigger a brief rebound in XAU/USD
Gold Price: Key levels to watch
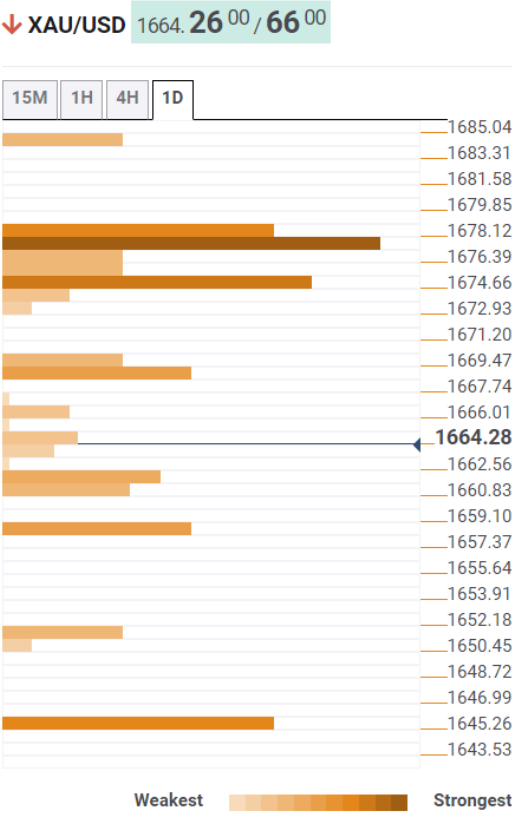
The Technical Confluence Detector shows that the gold price is looking for a sustained move below the previous day’s low of $1,660.
Selling pressure will intensify below the latter, calling for a test of the pivot point one-week S3 at $1,658.
A fresh downswing towards the pivot point one-day S1 at $1,651 will ensue.
On the flip side, XAU bulls could face a strong hurdle at $1,668 on the road to recovery. That level is the convergence of the Fibonacci 161.8% one-week and Fibonacci 23.6% one-day.
Further up, the Fibonacci 38.2% one-day at $1,675 will challenge bearish commitments. The confluence of the previous year’s low and the pivot point one-month around $1,678 will be the level to beat for gold buyers.
Here is how it looks on the tool
About Technical Confluences Detector
The TCD (Technical Confluences Detector) is a tool to locate and point out those price levels where there is a congestion of indicators, moving averages, Fibonacci levels, Pivot Points, etc. If you are a short-term trader, you will find entry points for counter-trend strategies and hunt a few points at a time. If you are a medium-to-long-term trader, this tool will allow you to know in advance the price levels where a medium-to-long-term trend may stop and rest, where to unwind positions, or where to increase your position size.
Author

Dhwani Mehta
FXStreet
Residing in Mumbai (India), Dhwani is a Senior Analyst and Manager of the Asian session at FXStreet. She has over 10 years of experience in analyzing and covering the global financial markets, with specialization in Forex and commodities markets.

















