|

Gold Price Forecast: XAU/USD advances despite rising US yields as bears take a breather

  • The XAU/USD trades at $2,030 seeing gains of 0.43%.
  • Key indicators on the daily chart signal that the bears are catching their breath after last week's strong movements.
  • The four-hour chart outlook suggests potential upward bias, with a positive RSI incline and MACD's green bars.

On Tuesday's session, the Gold spot price XAU/USD was spotted trading at $2,030, reflecting a 0.43% gain, as the bears are taking a breather after last week's notable 2% loss. The daily chart presents a neutral-to-bearish sentiment with the bears while, the four-hour indicators are slightly tilted to the upside, suggesting an imminent potential shift in momentum.

Fundamentally speaking, strong US economic data and hawkish sentiments from the Federal Reserve (Fed) have led to significant selling of metals, causing doubts about an impending Fed rate-cutting cycle. In that sense, as markets start to adjust their bets on the Fed, the upside potential for the metal is capped, as it is causing US yields, often seen as the cost of holding non-yielding metals to rise.

XAU/USD technical levels

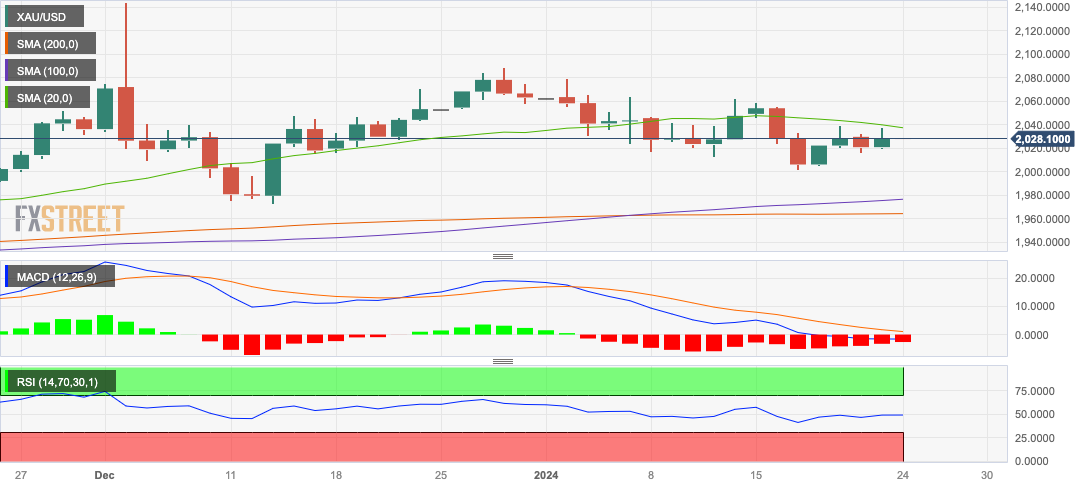
The Relative Strength Index (RSI) on the daily chart is flat on the negative side. The Moving Average Convergence Divergence (MACD) displays an equivalently flat activity with negative red bars evidencing bearish sentiment. Despite this, the metal continues to cling just below the 20-day Simple Moving Average (SMA), while managing to remain above the 100 and 200-day SMAs. The maintaining of a position above the longer-term SMAs underscores a ruling bullish perspective in a broader sense, even amidst the bearish undertones polarizing the immediate scenario, particularly after a 2% loss last week.

Zooming into the four-hour timeframe, the momentum subtly changes. The same indicators remain flat, albeit with a small bias towards a buying sentiment. As per the Relative Strength Index (RSI), it shows positive slope taking place within the positive domain. Concurrently, the Moving Average Convergence Divergence (MACD) reflects a stationary display of red bars.

XAU/USD

Overview
Today last price2028.72
Today Daily Change7.79
Today Daily Change %0.39
Today daily open2020.93
 
Trends
Daily SMA202041.98
Daily SMA502025.69
Daily SMA1001974.5
Daily SMA2001964.11
 
Levels
Previous Daily High2032.19
Previous Daily Low2016.61
Previous Weekly High2058.67
Previous Weekly Low2001.9
Previous Monthly High2144.48
Previous Monthly Low1973.13
Daily Fibonacci 38.2%2022.56
Daily Fibonacci 61.8%2026.24
Daily Pivot Point S12014.3
Daily Pivot Point S22007.66
Daily Pivot Point S31998.72
Daily Pivot Point R12029.88
Daily Pivot Point R22038.82
Daily Pivot Point R32045.46

XAU/USD daily chart

Author

Patricio Martín

Patricio is an economist from Argentina passionate about global finance and understanding the daily movements of the markets.

More from Patricio Martín
Share:

Editor's Picks

AUD/USD eyes 0.7150 barrier nine-day EMA

AUD/USD inches higher after registering modest losses in the previous day, trading around 0.7130 during the Asian hours. The technical analysis of the daily chart indicates that the pair is moving sideways within the rectangle pattern, suggesting a consolidation as neither the bulls nor the bears have enough momentum to take control of the market.

USD/JPY trades below 160.00 intervention threshold; bullish bias intact

The USD/JPY pair attracts some sellers during the Asian session amid fears that authorities will step in again to prop up the Japanese Yen. Furthermore, the Israel-Lebanon truce prompts some profit-taking around the US Dollar and exerts downward pressure on the currency pair.

Gold defends 200-day SMA at $4,425, but for how long?

Gold is attempting a tepid recovery toward $4,500 early Thursday, as renewed optimism in the Mideast geopolitical front calms market nerves. This cautious optimism across Asian markets weighs on Oil prices, and diminishes the US Dollar’s safe-haven appeal, helping Gold stage a decent comeback from the weekly low of $4,424.


Hyperliquid: ETF demand, capital rotation fuel HYPE rally as Bitcoin melts

Hyperliquid price sustains an upward trend near its all-time high of $75.76 on Thursday after posting 80% gains in May, while Bitcoin (BTC) retraces below $65,000, triggering a market-wide panic.

Kevin Warsh takes the Fed helm: What it means for the US Dollar
The Federal Reserve moves away from the highly predictable "forward guidance" model of the Jerome Powell era to a new “Kevin Warsh environment”, characterized by less communication, more policy surprises, and an increased focus on the Fed's complex balance sheet.
Recession on paper: What really moves the Canadian Loonie now?

Statistics Canada handed the headline writers a gift and the analysts a headache. Real GDP shrank 0.1% on an annualized basis in the first quarter, and with the fourth quarter of 2025 revised down to a 1.0% contraction, that is two negative quarters in a row, the textbook definition of a technical recession and Canada's first since the pandemic.