Gold Price Forecast: $1,960 could cap XAU/USD ahead of US CPI – Confluence Detector
- Gold edged lower on Tuesday and extended the overnight pullback from the multi-week high.
- The Fed’s hawkish outlook, surging US bond yields continued acting as a headwind for the metal.
- Worries about stubbornly high inflation should help limit losses ahead of the key US CPI report.

Gold struggled to capitalize on its early uptick and attracted some selling around the $1,960 region on Tuesday. The pullback extended through the first half of the European session and dragged spot gold further away from the four-week high touched the previous day. The prospects for a faster policy tightening by the Fed pushed the US Treasury bond yields to a fresh multi-year peak and acted as a headwind for the non-yielding yellow metal. That said, concerns that the war in Ukraine and tough new COVID-19 restrictions in China could hit global growth could limit losses for the safe-haven XAU/USD. Apart from this, worries that the recent surge in commodity prices would put upward pressure on already high consumer prices could further benefit the metal's appeal as a hedge against inflation. Hence, the market focus will remain on the US CPI report, scheduled for release later during the early North American session.
Gold: Key levels to watch
The Technical Confluences Detector shows that any subsequent slide is likely to attract some buying near the $1,952-51 region - the Fibonacci 61.8% one day. The next relevant support is pegged near the $1,941 area - the Fibonacci 23.6% one week - ahead of the $1,937 zone, marking the 5-day SMA. A convincing break below could negate prospects for any further near-term appreciating move and drag spot gold to the $1,921-$1,919 intermediate support en-route the $1,900 round-figure mark.
On the flip side, the $1,960 region now seems to have emerged as an immediate strong barrier. The said resistance is the convergence of the Fibonacci 38.2% one day, Pivot Point one week R1, Bollinger Band one-day Upper and the Fibonacci 61.8% one month. Sustained strength beyond would be seen as a fresh trigger for bullish traders and pave the way for a move back towards the $2,000 psychological mark.
Here is how it looks on the tool
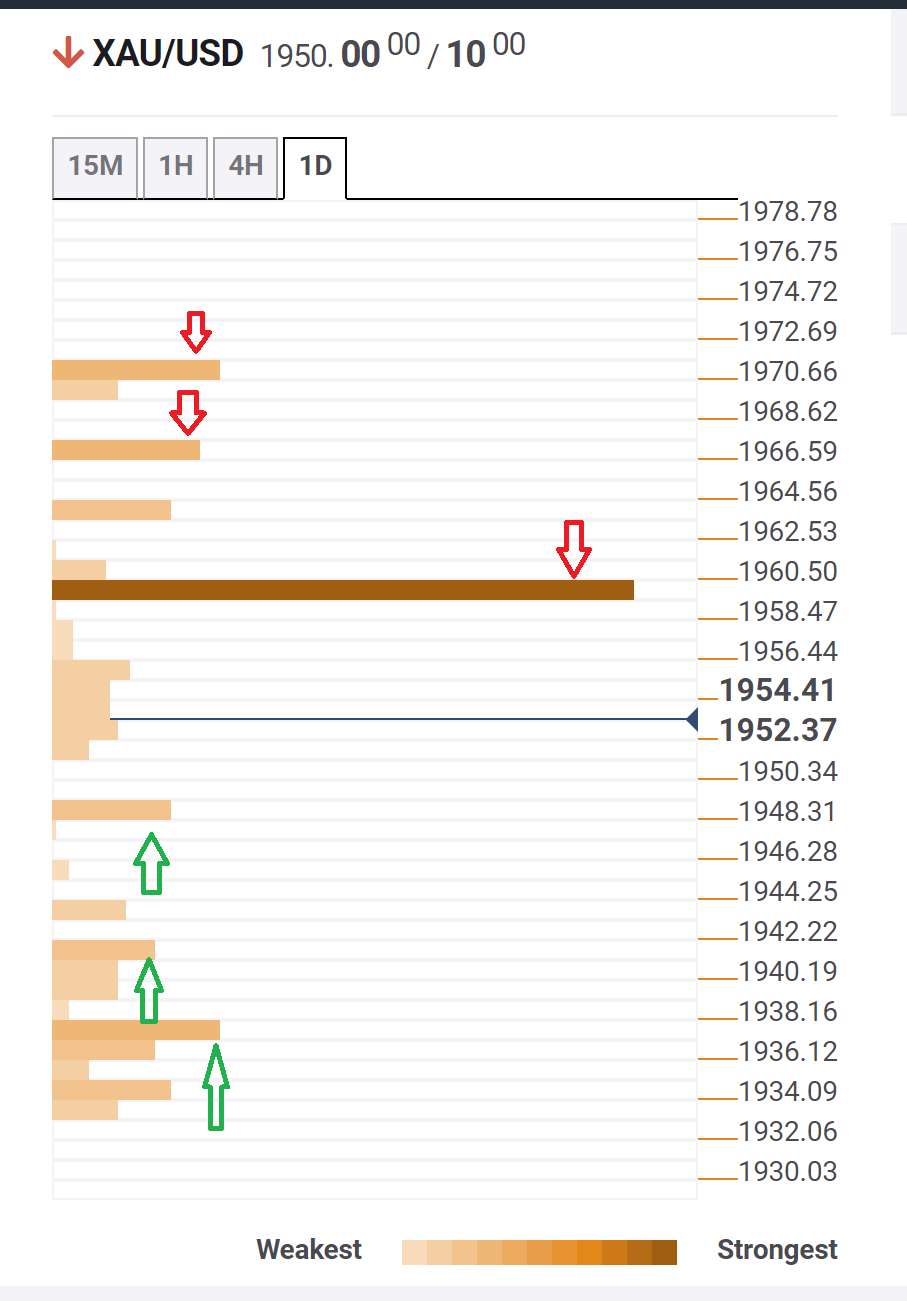
About Technical Confluences Detector
The TCD (Technical Confluences Detector) is a tool to locate and point out those price levels where there is a congestion of indicators, moving averages, Fibonacci levels, Pivot Points, etc. If you are a short-term trader, you will find entry points for counter-trend strategies and hunt a few points at a time. If you are a medium-to-long-term trader, this tool will allow you to know in advance the price levels where a medium-to-long-term trend may stop and rest, where to unwind positions, or where to increase your position size.
Author

Haresh Menghani
FXStreet
Haresh Menghani is a detail-oriented professional with 10+ years of extensive experience in analysing the global financial markets.

















