Gold Price Forecast: $1,788 appears a tough nut to crack for XAU/USD bulls – Confluence Detector
- Gold price is finding fresh demand as US Dollar extends retreat.
- Hawkish Fed and ECB policy decisions could keep Gold price rebound short-lived.
- Focus shifts to next week’s US PCE inflation, as Gold price remains in a familiar range.

Gold price is attempting a tepid comeback following a massive sell-off witnessed on the back of the hawkish policy outlook adopted by the US Federal Reserve (Fed) and the European Central Bank (ECB) at their respective monetary policy meetings. Both central banks remain committed to keeping interest rates higher until inflation is brought down in a sustained manner. The non-interest-bearing Gold price tends to suffer in a higher interest rates environment. The latest bounce in the bright metal could be linked to the retreat in the US Dollar across the board, as the dust settles over the bumper central bankers’ events. As the Fed remains data-dependent, attention now turns toward the US PCE Price Index, the Fed’s preferred inflation, due next week for fresh hints on the US central banks’ future policy course.
Also read: The story about Gold and the Fed’s U-turn
Gold Price: Key levels to watch
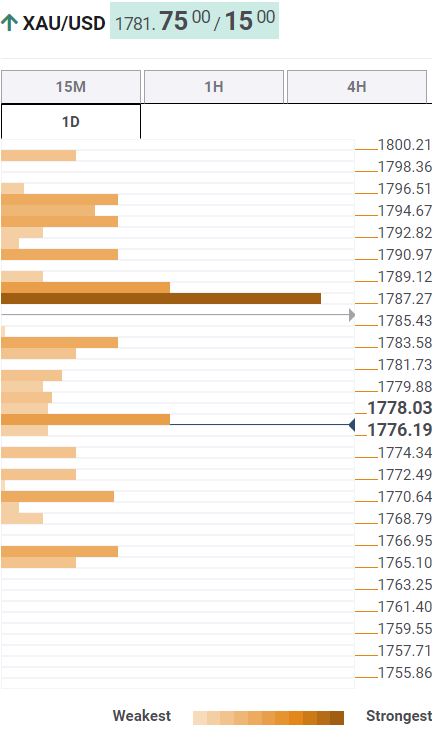
The Technical Confluence Detector shows that the gold price is looking to build its rebound toward the convergence of the Fibonacci 38.2% one-week and Fibonacci 236.6% one-day at $1,783.
A firm break above the latter will add extra zest to the recovery in Gold price, allowing a test of the powerful resistance at around $1,788. That level is the confluence of the previous month’s high, SMA200 one-day, Fibonacci 38.2% one-day and SMA10 one-day.
The next significant upside barrier is seen around $1,793, where the Fibonacci 61.8% one-day and SMA5 one-day coincide.
Alternatively, strong support awaits at the Fibonacci 23.6% one-week at $1,777, below which the previous day’s low at $1,774 will get retested.
The last line of defense for Gold bulls is seen at the previous week’s low at $1,766.
Here is how it looks on the tool
About Technical Confluences Detector
The TCD (Technical Confluences Detector) is a tool to locate and point out those price levels where there is a congestion of indicators, moving averages, Fibonacci levels, Pivot Points, etc. If you are a short-term trader, you will find entry points for counter-trend strategies and hunt a few points at a time. If you are a medium-to-long-term trader, this tool will allow you to know in advance the price levels where a medium-to-long-term trend may stop and rest, where to unwind positions, or where to increase your position size.
Author

Dhwani Mehta
FXStreet
Residing in Mumbai (India), Dhwani is a Senior Analyst and Manager of the Asian session at FXStreet. She has over 10 years of experience in analyzing and covering the global financial markets, with specialization in Forex and commodities markets.

















