Gold is sold while oil supply constriction continues

Executive summary
- Trend bias: Gold continues its decline in a corrective wave.
- Current action: A decline to $3,650 – $4,100 and possibly lower levels appears as the higher probability trend.
- Key level: A print above $4,602 suggests the first part or all of the decline is likely over.
On March 9, we forecasted a decline in gold to below $4,400. Gold reached a low of $4,099 on March 23. Our Elliott wave model hints that the decline is incomplete.
With west Asian oil exporters unable to ship their oil through the Strait of Hormuz, it has placed them in a cash crunch. In an effort to raise cash, selling anything liquid, like gold, to raise funds has pushed the price of gold lower.
Current Elliott Wave analysis
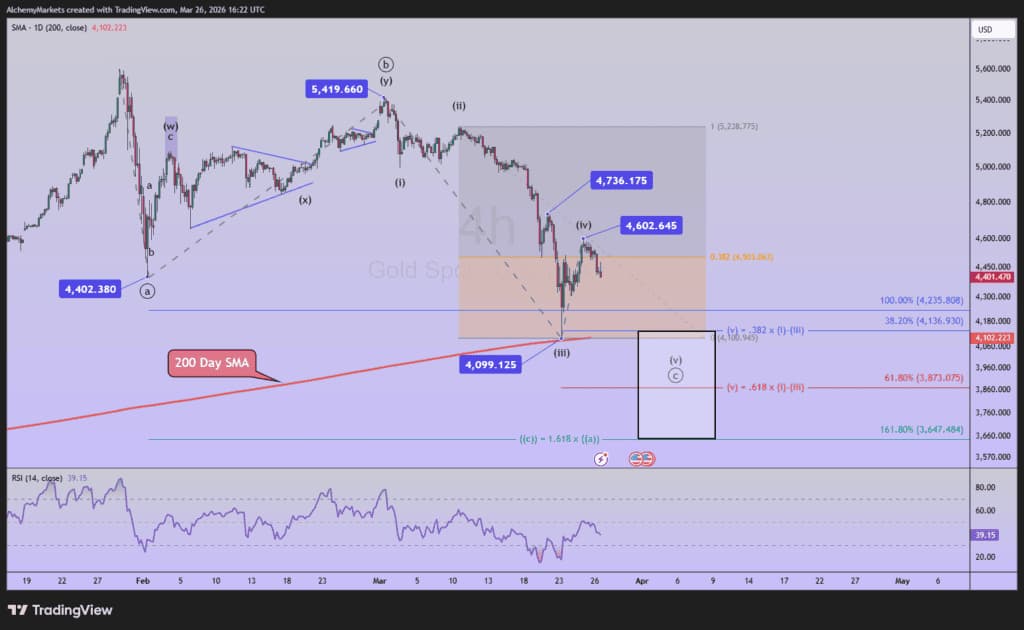
The current Elliott wave chart of Gold shows an incomplete down trend. We are anticipating a 5-wave decline from the March 2 high of $5,419.
So far, it appears only 4 of those waves are in place. Therefore, a fifth and final wave lower is anticipated in the coming days to complete the Elliott wave impulse pattern.
There are a couple of factors that lead me to believe that one more decline is needed to complete the bearish pattern.
Wave (iii) reached a 2.618 Fibonacci extension of wave (i). This is an extended wave (iii) and the 2.618 multiple is a common relationship.
Additionally, the 200 day Simple Moving Average hovers near March 23 low, so the bounce higher is from a confluence of technical levels.
Oftentimes, after an extended 3rd wave, wave (iv) will retrace a Fibonacci 38% the length of wave (iii). The rally to $4,602 on March 25 satisfies this guideline.
Therefore, the gold market is set up for a wave (v) decline that may reach $3,650 – $4,100 according to the Elliott wave models. If that final decline plays out, then wave ((c)) likely terminates and the entire correction from January 28 may be completed.
Bottom line
Gold prices appear to be in the terminal wave of the decline that began on January 28. We suspect gold prices are starting another decline to around $3,650 – $4,100 to finalize wave (v) of ((c)).
If gold prices push above $4,602, then we’ll consider an alternative scenario of a medium-term bottom this week.
Author

Zorrays Junaid
Alchemy Markets
Zorrays Junaid has extensive combined experience in the financial markets as a portfolio manager and trading coach. More recently, he is an Analyst with Alchemy Markets, and has contributed to DailyFX and Elliott Wave Forecast in the past.

















