Gold recovers above $4,000 after US PCE data broadly matches expectations
- Gold rebounds from a more than seven-month low after the latest US inflation report.
- US PCE data came broadly in line with market expectations.
- Technically, XAU/USD remains in a well-defined downtrend, with oversold signals beginning to emerge.

Gold (XAU/USD) shows signs of stabilization on Thursday as traders digest the latest US Personal Consumption Expenditures (PCE) Price Index, which came broadly in line with market expectations. At the time of writing, XAU/USD trades around $4,036 after hitting a more than seven-month low of $3,959 on Wednesday.
The US Bureau of Economic Analysis reported that core PCE rose to 3.4% YoY in May from 3.3% in April. On a monthly basis, Core PCE was unchanged at 0.3%. Headline PCE accelerated to 4.1% YoY from 3.8%, marking its highest annual reading since April 2023.
Traders focused on the stable core PCE reading, the Federal Reserve's (Fed) preferred inflation gauge, which weighed modestly on the US Dollar (USD) and helped XAU/USD rebound from below the $4,000 mark.
Even so, the metal remains nearly 27% below its all-time high near $5,600 reached in January. The decline has been largely driven by the fallout from the US-Iran war, which boosted the US Dollar (USD), triggered liquidity-driven selling and fueled expectations that the Fed could raise interest rates later this year as elevated Oil prices pushed inflation higher.
The latest inflation data did little to challenge the higher-for-longer interest rate narrative. According to the CME FedWatch Tool, traders are currently pricing in a 60% chance of a rate hike at the September meeting, down from 67% earlier in the day.
However, with Oil prices back to pre-war levels, fears of a sustained inflationary shock have eased. Still, inflation remains well above the Fed's 2% target, suggesting monetary policy is likely to stay restrictive for longer. As a result, Gold may struggle to stage a meaningful recovery.
Additional data showed the US economy expanded at an annualized pace of 2.1% in the first quarter, up from of 1.6%, according to the final estimate.
On the geopolitical front, shipping through the Strait of Hormuz continues to improve following the interim peace agreement between the United States and Iran. The latest round of talks revealed that differences remain over inspections of Iran's nuclear program and the future management of the Strait.
Technical Analysis: Bearish trend remains intact as oversold signals emerge
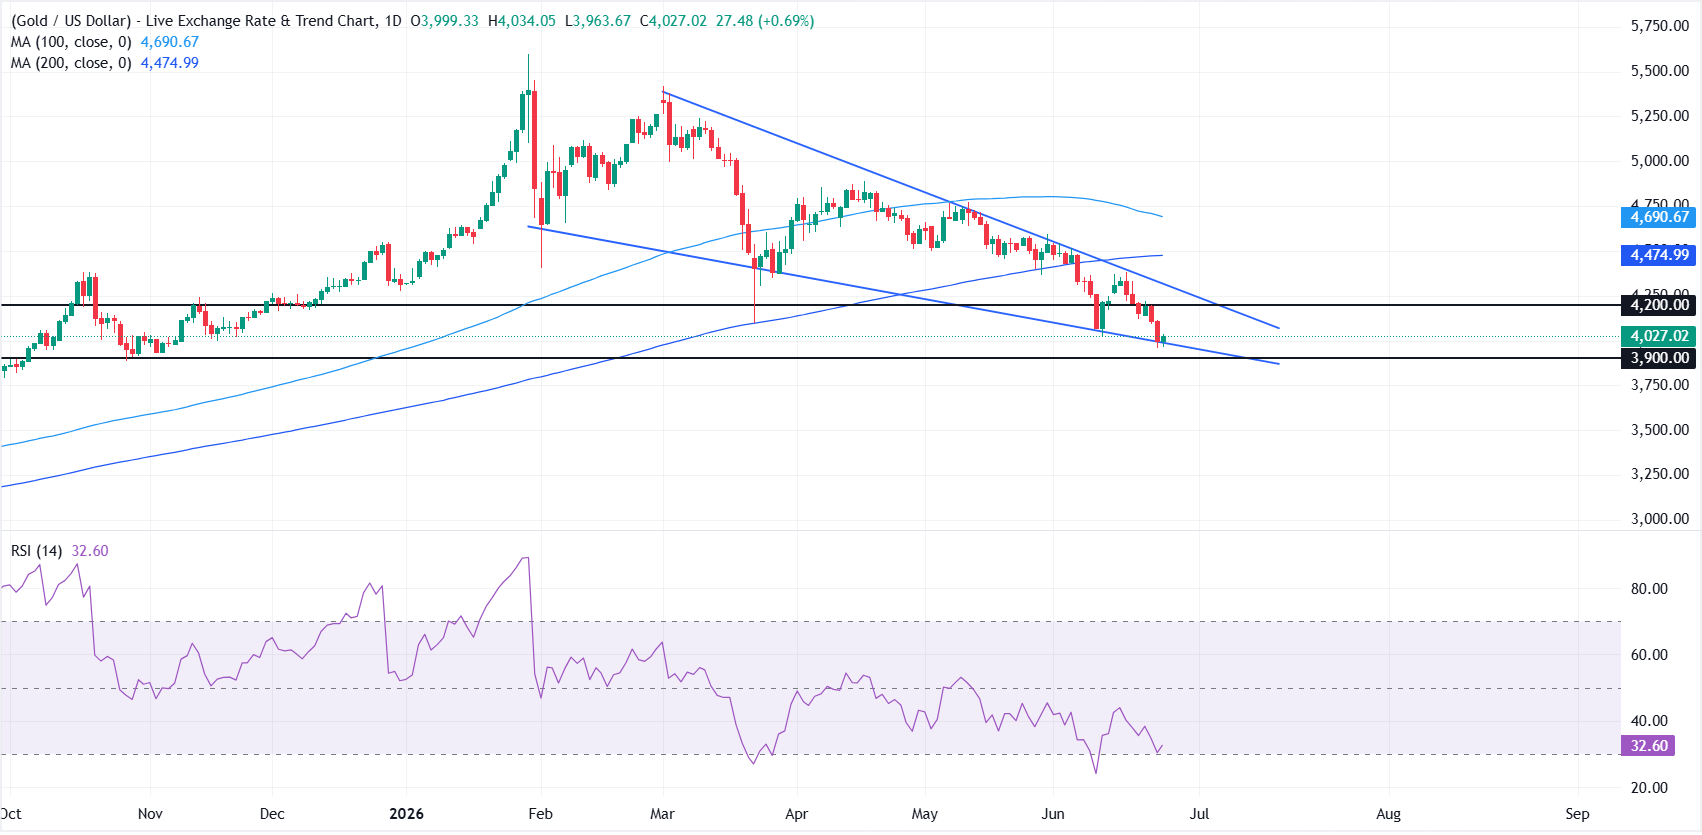
On the daily chart, XAU/USD remains bearish as price holds well below the 200-day Simple Moving Average (SMA) at $4,474 and the 100-day SMA at $4,690.
The metal also remains under a downward sloping resistance trend line, whose break level comes in near $4,350, while the Relative Strength Index (RSI) at 29.87 slips into oversold territory, hinting that while selling pressure dominates, the downside could become vulnerable to short-covering bounces.
On the upside, initial resistance is seen at the horizontal barrier around $4,200, with the descending trend-line break level near $4,350 reinforcing this supply zone. Above that, the 200-day SMA at $4,474 and the 100-day SMA at $4,690 form a broader medium-term resistance band that would need to be reclaimed to ease the prevailing bearish structure.
On the downside, the next notable cushion is the horizontal support at $3,900.00, and a clear break beneath this floor would expose the metal to a deeper corrective phase despite the emerging oversold signals on momentum.
(The technical analysis of this story was written with the help of an AI tool.)
Inflation FAQs
Inflation measures the rise in the price of a representative basket of goods and services. Headline inflation is usually expressed as a percentage change on a month-on-month (MoM) and year-on-year (YoY) basis. Core inflation excludes more volatile elements such as food and fuel which can fluctuate because of geopolitical and seasonal factors. Core inflation is the figure economists focus on and is the level targeted by central banks, which are mandated to keep inflation at a manageable level, usually around 2%.
The Consumer Price Index (CPI) measures the change in prices of a basket of goods and services over a period of time. It is usually expressed as a percentage change on a month-on-month (MoM) and year-on-year (YoY) basis. Core CPI is the figure targeted by central banks as it excludes volatile food and fuel inputs. When Core CPI rises above 2% it usually results in higher interest rates and vice versa when it falls below 2%. Since higher interest rates are positive for a currency, higher inflation usually results in a stronger currency. The opposite is true when inflation falls.
Although it may seem counter-intuitive, high inflation in a country pushes up the value of its currency and vice versa for lower inflation. This is because the central bank will normally raise interest rates to combat the higher inflation, which attract more global capital inflows from investors looking for a lucrative place to park their money.
Formerly, Gold was the asset investors turned to in times of high inflation because it preserved its value, and whilst investors will often still buy Gold for its safe-haven properties in times of extreme market turmoil, this is not the case most of the time. This is because when inflation is high, central banks will put up interest rates to combat it. Higher interest rates are negative for Gold because they increase the opportunity-cost of holding Gold vis-a-vis an interest-bearing asset or placing the money in a cash deposit account. On the flipside, lower inflation tends to be positive for Gold as it brings interest rates down, making the bright metal a more viable investment alternative.
Author

Vishal Chaturvedi
FXStreet
I am a macro-focused research analyst with over four years of experience covering forex and commodities market. I enjoy breaking down complex economic trends and turning them into clear, actionable insights that help traders stay ahead of the curve.