GDX Elliott Wave bearish sequence intact as it turns lower in renewed weakness [Video]
![GDX Elliott Wave bearish sequence intact as it turns lower in renewed weakness [Video]](https://editorial.fxsstatic.com/images/i/discover-50.png)
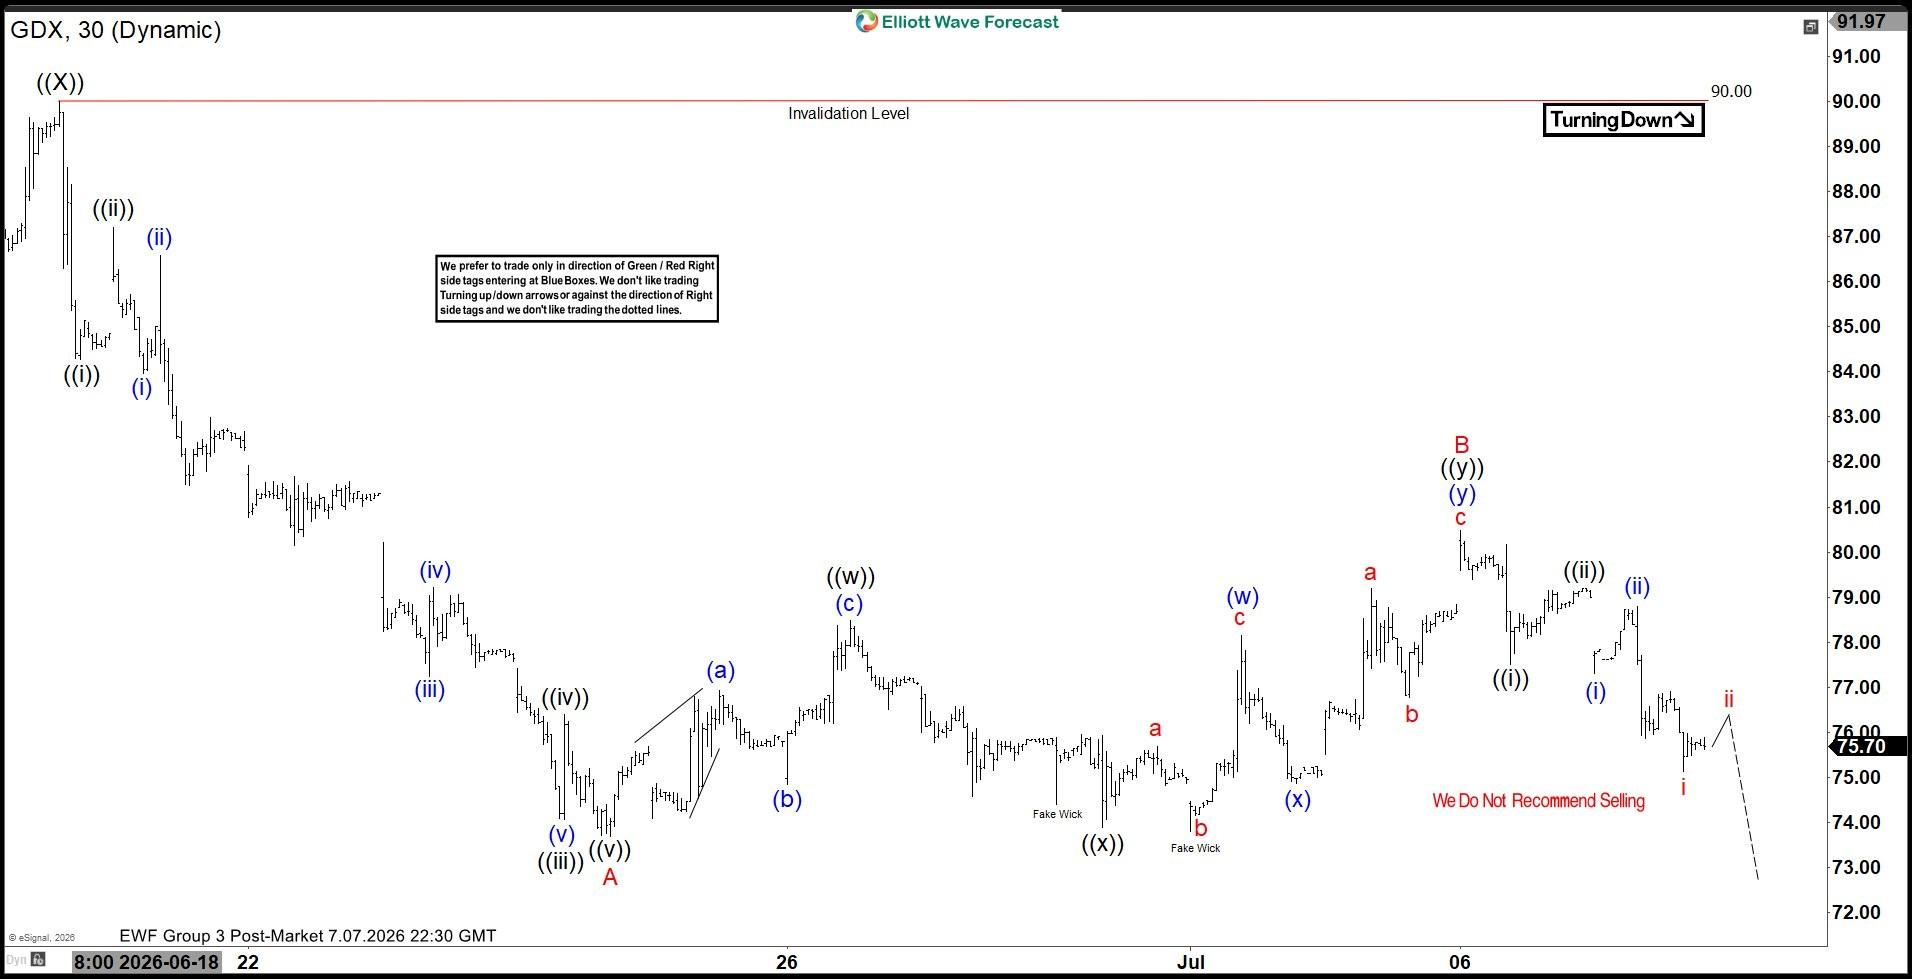
The Gold Miners ETF (GDX) continues to exhibit an incomplete bearish sequence from the March 2, 2026 high, and this structure still favors additional downside. The broader decline retains a clear impulsive and corrective rhythm, which strengthens the case for further weakness before a more durable recovery can emerge. The ideal downside target is measured by the 100% to 161.8% Fibonacci extension taken from the March 2 peak. This region, located at $33 to $59, represents a technically significant support zone where buyers may attempt to establish a three‑wave rally at minimum. The near‑term cycle from the June 18 high remains active and continues to unfold as a zigzag structure.
From the June 18 pivot, wave ((i)) ended at $84.28, followed by a modest recovery in wave ((ii)) that ended at $87.21. The ETF then turned lower in wave ((iii)) toward $74.08, and the subsequent wave ((iv)) rally ended at $76.40. The final leg of the sequence, wave ((v)), reached $73.70, which completed wave A at a higher degree. After that low, wave B developed as a double three structure. Up from wave A, wave ((w)) ended at $78.48, while wave ((x)) concluded at $73.89. The final push higher in wave ((y)) ended at $80.47, completing wave B.
GDX has since resumed its decline. As long as the pivot at $90 remains intact, the broader bearish sequence should continue to extend lower.
Gold Miners ETF (GDX) 30-minute Elliott Wave chart
GDX Elliott Wave [Video]
Author

Elliott Wave Forecast Team
ElliottWave-Forecast.com

















