GBP/USD Technical Analysis: Traders are playing ping pong between 1.2700 and 1.2800 figures

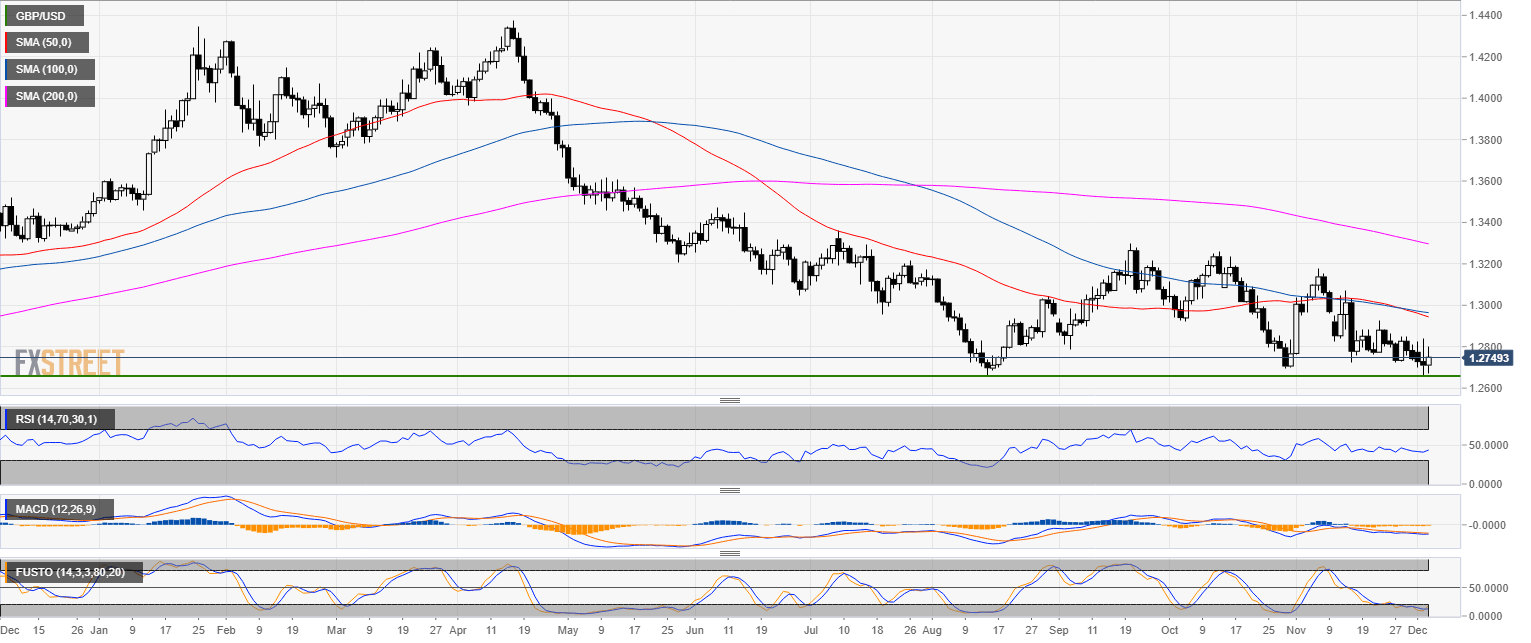
GBP/USD daily chart
- GBP/USD is trading in a bear trend below the 200-day simple moving average (SMA).
- GBP/USD is trading near 4-month’s lows.
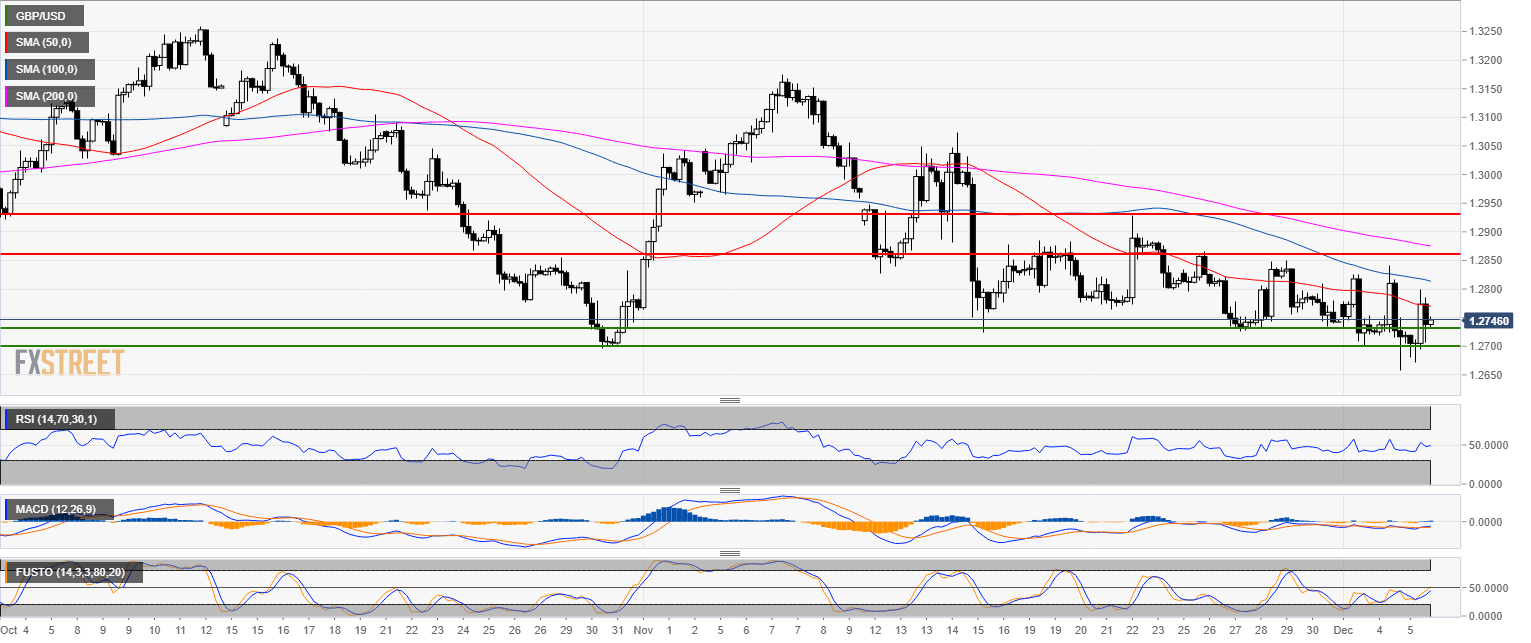
GBP/USD 4-hour chart
- GBP/USD is trading below its main SMAs.
- Market players are playing ping pong between the 1.2700 and 1.2800 figures.
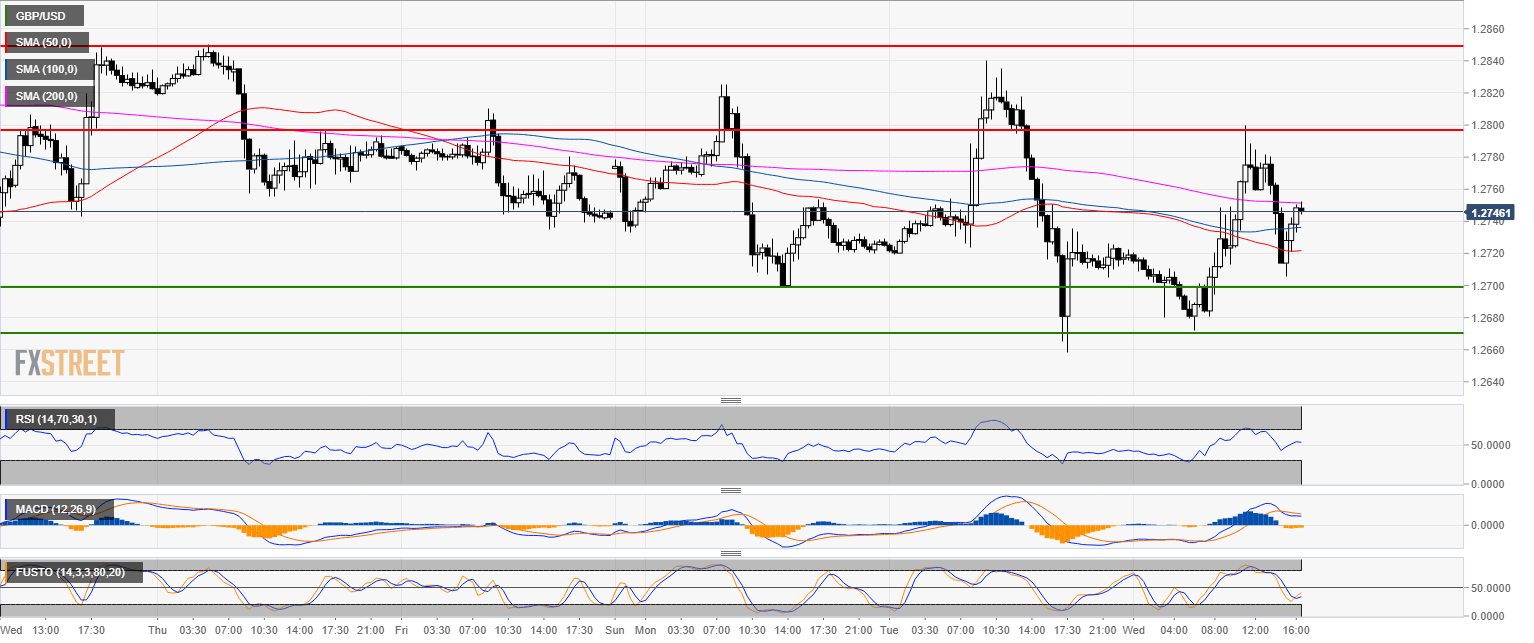
GBP/USD 30-minute chart
- GBP/USD finds some resistance at the 200 SMA.
- Cable remains weak and a drop to 1.2700 and 1.2670 might be next.
Key additional level
GBP/USD
Overview:
Today Last Price: 1.2748
Today Daily change: 37 pips
Today Daily change %: 0.291%
Today Daily Open: 1.2711
Trends:
Previous Daily SMA20: 1.2852
Previous Daily SMA50: 1.2952
Previous Daily SMA100: 1.2968
Previous Daily SMA200: 1.3304
Levels:
Previous Daily High: 1.284
Previous Daily Low: 1.2659
Previous Weekly High: 1.2864
Previous Weekly Low: 1.2725
Previous Monthly High: 1.3176
Previous Monthly Low: 1.2723
Previous Daily Fibonacci 38.2%: 1.2728
Previous Daily Fibonacci 61.8%: 1.2771
Previous Daily Pivot Point S1: 1.2633
Previous Daily Pivot Point S2: 1.2555
Previous Daily Pivot Point S3: 1.2452
Previous Daily Pivot Point R1: 1.2815
Previous Daily Pivot Point R2: 1.2918
Previous Daily Pivot Point R3: 1.2996
Author

Flavio Tosti
Independent Analyst


