|

GBP/USD Technical Analysis: Cable at daily lows below 1.3300 figure
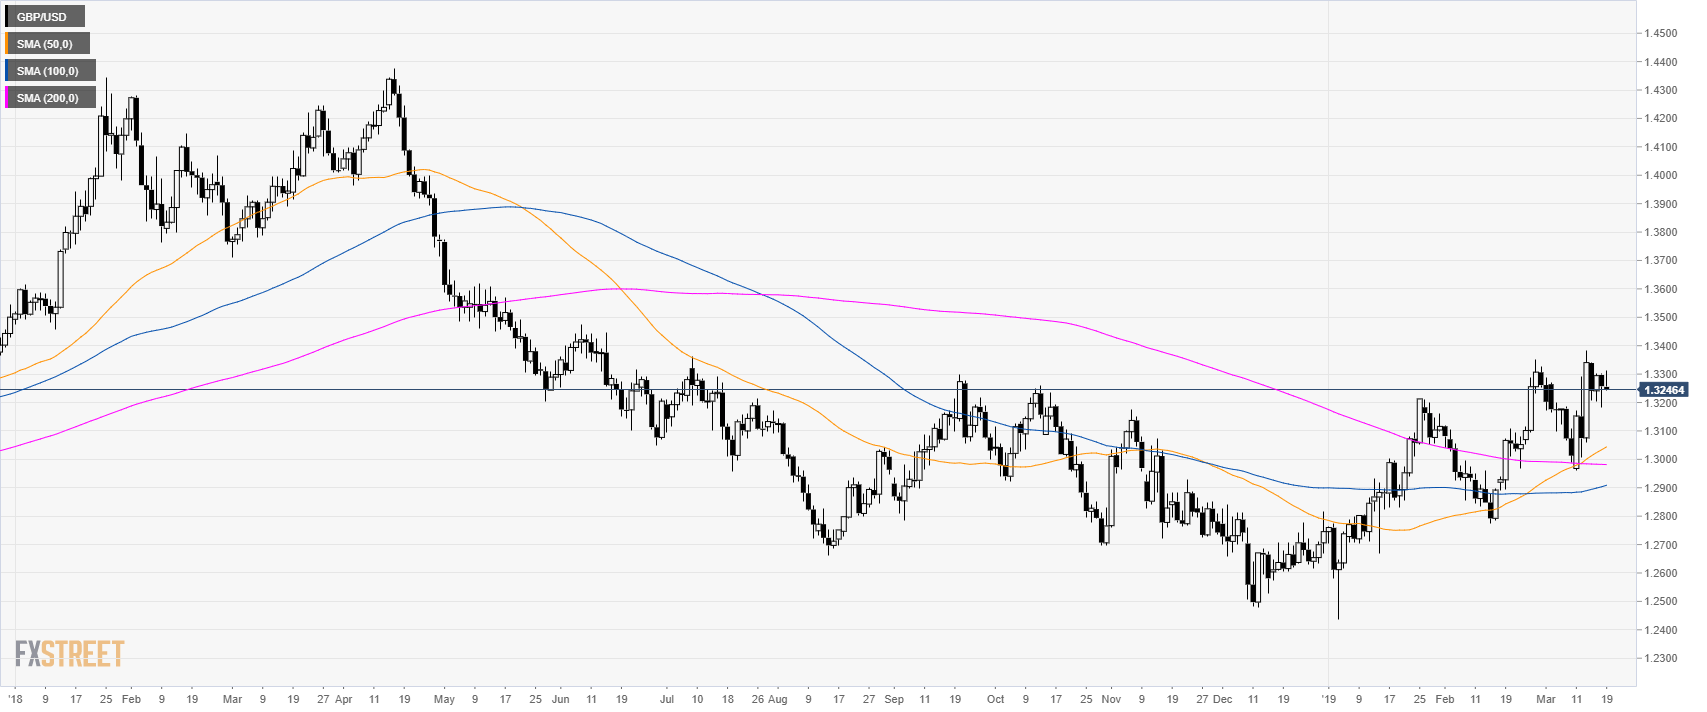
GBP/USD daily chart

  • GBP/USD is trading in a bull trend above its main simple moving averages (SMAs).

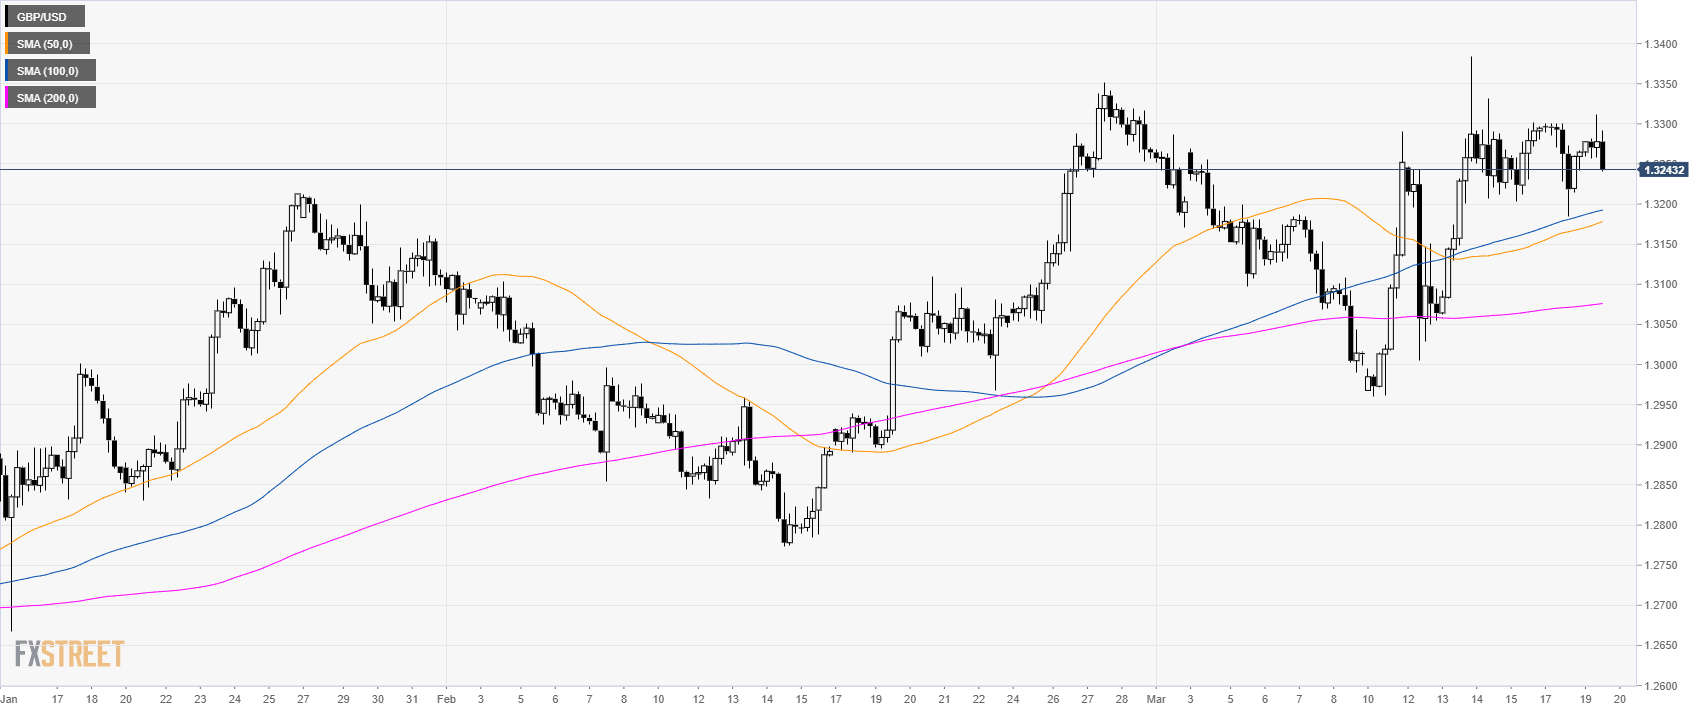
GBP/USD 4-hour chart

  • GBP/USD is trading above its main SMAs suggesting bullish momentum in the medium-term.

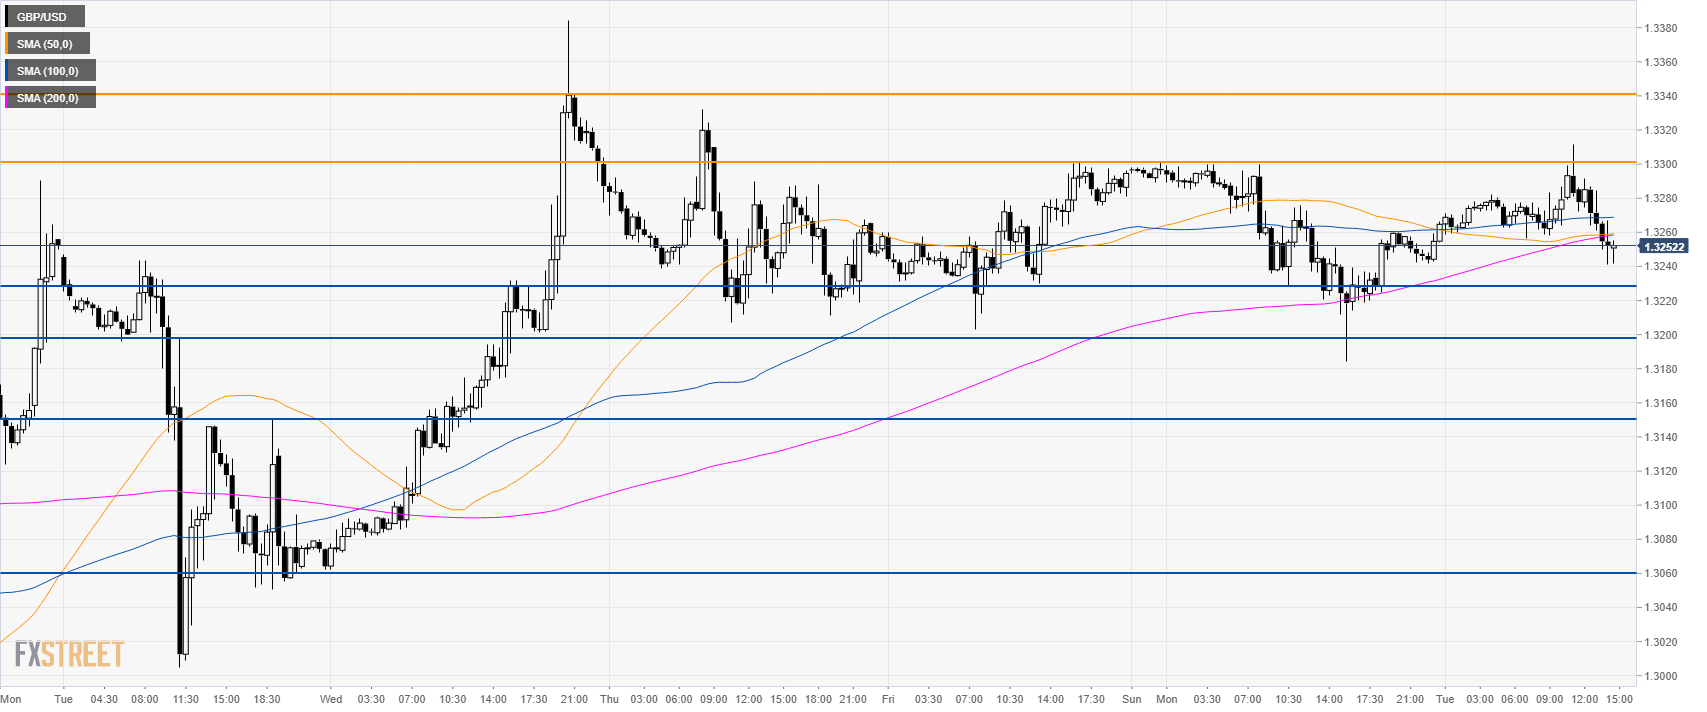
GBP/USD 30-minute chart

  • GBP/USD is trading below its main SMAs suggesting bearish momentum in the short-term.
  • Support is seen at 1.3230, 1.3200 figure and 1.3170 level.
  • To the upside, resistance is at 1.3300 figure and 1.3340 level.

Additional key levels

GBP/USD

Overview:
    Today Last Price: 1.3252
    Today Daily change: -6 pips
    Today Daily change %: -0.05%
    Today Daily Open: 1.3258
Trends:
    Daily SMA20: 1.3166
    Daily SMA50: 1.3034
    Daily SMA100: 1.2903
    Daily SMA200: 1.2982
Levels:
    Previous Daily High: 1.3301
    Previous Daily Low: 1.3184
    Previous Weekly High: 1.3384
    Previous Weekly Low: 1.296
    Previous Monthly High: 1.3351
    Previous Monthly Low: 1.2773
    Daily Fibonacci 38.2%: 1.3229
    Daily Fibonacci 61.8%: 1.3256
    Daily Pivot Point S1: 1.3194
    Daily Pivot Point S2: 1.313
    Daily Pivot Point S3: 1.3077
    Daily Pivot Point R1: 1.3311
    Daily Pivot Point R2: 1.3365
    Daily Pivot Point R3: 1.3428

Author

Flavio Tosti

Flavio Tosti

Independent Analyst


More from Flavio Tosti
Share:

Editor's Picks

EUR/USD recedes to daily lows near 1.1850

EUR/USD keeps its bearish momentum well in place, slipping back to the area of 1.1850 to hit daily lows on Monday. The pair’s continuation of the leg lower comes amid decent gains in the US Dollar in a context of scarce volatility and thin trade conditions due to the inactivity in the US markets.

GBP/USD resumes the downtrend, back to the low-1.3600s

GBP/USD rapidly leaves behind Friday’s decent advance, refocusing on the downside and retreating to the 1.3630 region at the beginning of the week. In the meantime, the British Pound is expected to remain under the microscope ahead of the release of the key UK labour market report on Tuesday.

Gold looks inconclusive around $5,000

Gold partially fades Friday’s strong recovery, orbiting around the key $5,000 region per troy ounce in a context of humble gains in the Greenback on Monday. Additing to the vacillating mood, trade conditions remain thin amid the observance of the Presidents Day holiday in the US.

Bitcoin consolidates as on-chain data show mixed signals

Bitcoin price has consolidated between $65,700 and $72,000 over the past nine days, with no clear directional bias. US-listed spot ETFs recorded a $359.91 million weekly outflow, marking the fourth consecutive week of withdrawals.

The week ahead: Key inflation readings and why the AI trade could be overdone

It is likely to be a quiet start to the week, with US markets closed on Monday for Presidents Day. European markets are higher across the board and gold is clinging to the $5,000 level after the tamer than expected CPI report in the US reduced haven flows to precious metals.

XRP steadies in narrow range as fund inflows, futures interest rise

Ripple is trading in a narrow range between $1.45 (immediate support) and $1.50 (resistance) at the time of writing on Monday. The remittance token extended its recovery last week, peaking at $1.67 on Sunday from the weekly open at $1.43.