GBP/USD Price Forecast: Steadies at around 1.2600
- GBP/USD remains flat, with potential for movement pending UK economic updates and Fed speakers.
- Technicals suggest vulnerability to further downside if 1.2600 support breaks, with next key levels at 1.2596 and 1.2445.
- A move above 1.2696 could test resistance at 1.2700, with significant upside resistance at the 200-day SMA of 1.2817.

The GBP/USD fluctuates, yet it remains virtually unchanged at the beginning of the week as UK traders await the release of UK inflation figures and Retail Sales data. In the meantime, aside from Fed speakers, a scarce economic docket in the US might pave the way for some consolidation on the major. The pair trades at 1.2628, flat.
GBP/USD Price Forecast: Technical outlook
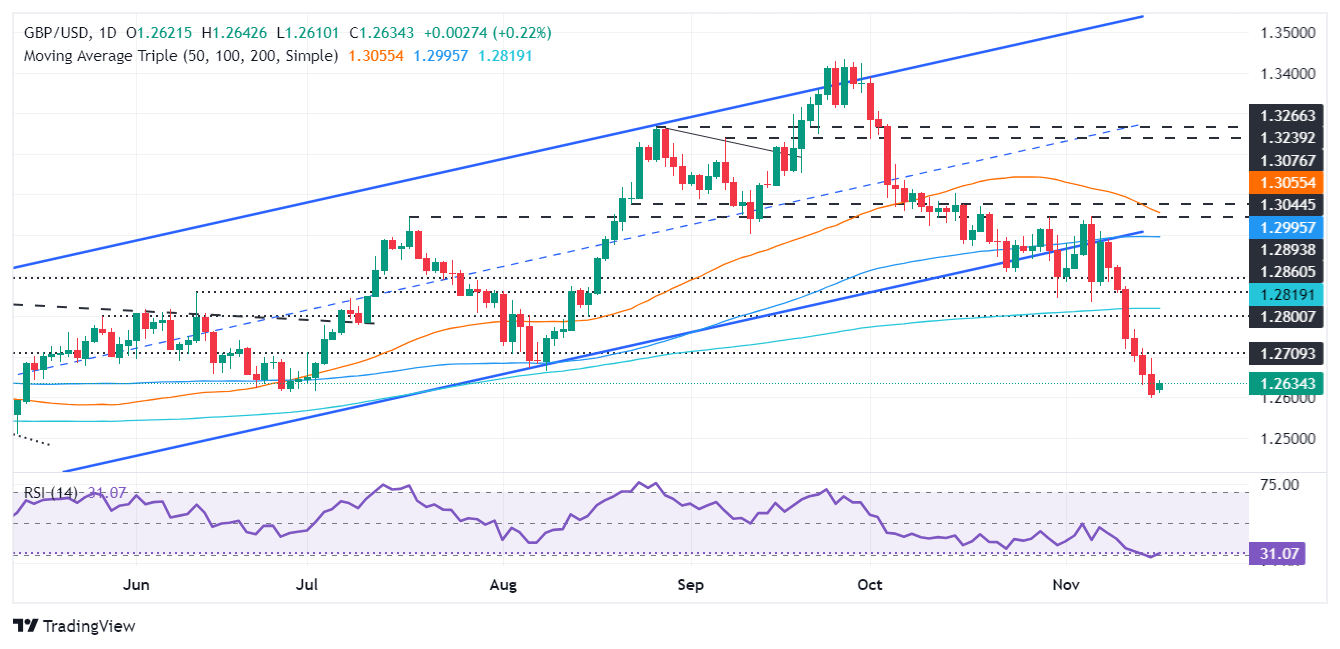
The breach of the August 8 daily low of 1.2664 opened the door for further GBP&USD downside. Although the pair has reclaimed the 1.2600 figure, sellers remain in charge. If bears push the exchange rate below 1.2600, the next support would be a November 15 swing low of 1.2596. Once surpassed, the next stop would be the May 9 low of .12445.
On the other hand, if GBP/USD climbs past the November 15 high of 1.2696, 1.2700 will follow. Further upside is seen above 1.2800, with the 200-day Simple Moving Average (SMA) standing at the crucial support level of 1.2817.
Oscillators such as the Relative Strength Index (RSI) give buyers the upper hand in the short term. However, the RSI remains bearish below its neutral line, putting a lid on GBP/USD upside.
GBP/USD Price Chart – Daily
British Pound PRICE Today
The table below shows the percentage change of British Pound (GBP) against listed major currencies today. British Pound was the strongest against the Japanese Yen.
| USD | EUR | GBP | JPY | CAD | AUD | NZD | CHF | |
|---|---|---|---|---|---|---|---|---|
| USD | -0.28% | -0.09% | 0.40% | -0.16% | -0.23% | 0.09% | -0.25% | |
| EUR | 0.28% | 0.34% | 0.77% | 0.22% | 0.20% | 0.48% | 0.14% | |
| GBP | 0.09% | -0.34% | 0.45% | -0.11% | -0.14% | 0.14% | -0.21% | |
| JPY | -0.40% | -0.77% | -0.45% | -0.57% | -0.57% | -0.26% | -0.58% | |
| CAD | 0.16% | -0.22% | 0.11% | 0.57% | -0.05% | 0.25% | -0.09% | |
| AUD | 0.23% | -0.20% | 0.14% | 0.57% | 0.05% | 0.29% | -0.05% | |
| NZD | -0.09% | -0.48% | -0.14% | 0.26% | -0.25% | -0.29% | -0.33% | |
| CHF | 0.25% | -0.14% | 0.21% | 0.58% | 0.09% | 0.05% | 0.33% |
The heat map shows percentage changes of major currencies against each other. The base currency is picked from the left column, while the quote currency is picked from the top row. For example, if you pick the British Pound from the left column and move along the horizontal line to the US Dollar, the percentage change displayed in the box will represent GBP (base)/USD (quote).
Author

Christian Borjon Valencia
FXStreet
Markets analyst, news editor, and trading instructor with over 14 years of experience across FX, commodities, US equity indices, and global macro markets.


