GBP/USD Price Forecast: Rebounds toward 1.3750 near multi-year highs
- GBP/USD may find resistance at 1.3770, the highest since October 2021.
- A break above the 70 mark would signal overbought conditions, suggesting a potential downward correction ahead.
- The primary support appears at the nine-day EMA of 1.3635.

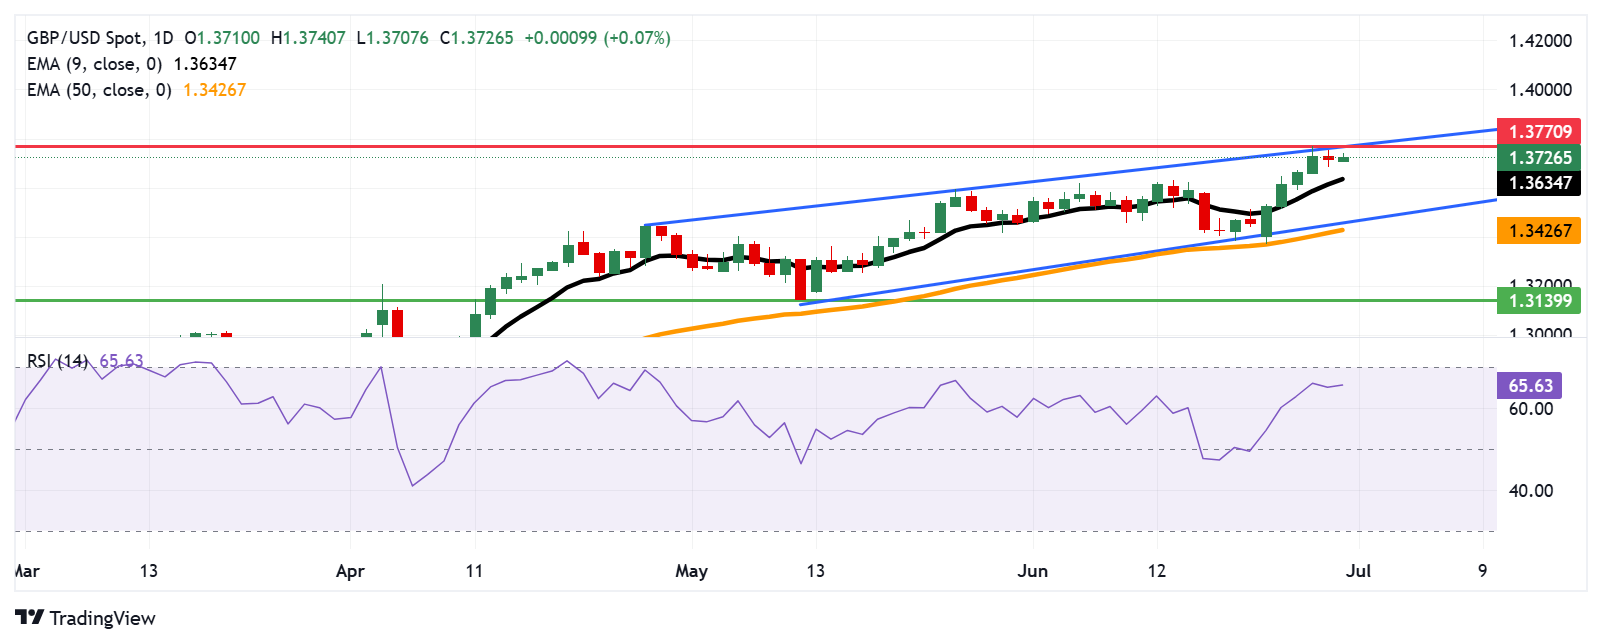
The GBP/USD pair retraces its recent losses from the previous session, trading around 1.3730 during the Asian hours on Monday. The bullish bias persists as the daily chart’s technical analysis indicates that the pair moves upwards within the ascending channel pattern.
The 14-day Relative Strength Index (RSI) remains slightly below the 70 level, strengthening the bullish bias. However, a breach above the 70 mark would indicate an oversold situation and a downward correction soon. Additionally, the GBP/USD pair rises above the nine-day Exponential Moving Average (EMA), suggesting the short-term price momentum is stronger.
On the upside, the GBP/USD pair is poised to test the 1.3770, the highest since October 2021, which was recorded on June 26, aligned with the upper boundary of the ascending channel. A successful breach above this crucial resistance zone could reinforce the bullish bias and support the pair to approach the psychological level of 1.3800.
The GBP/USD pair could find the initial support at the nine-day EMA of 1.3634. A break below this level could weaken the short-term price momentum and put downward pressure on the pair to test the ascending channel’s lower boundary around 1.3460, followed by the 50-day EMA at 1.3426. Further declines could open the doors for the pair to navigate the region around the two-month low at 1.3139, recorded on May 12.
GBP/USD: Daily Chart
Pound Sterling FAQs
The Pound Sterling (GBP) is the oldest currency in the world (886 AD) and the official currency of the United Kingdom. It is the fourth most traded unit for foreign exchange (FX) in the world, accounting for 12% of all transactions, averaging $630 billion a day, according to 2022 data. Its key trading pairs are GBP/USD, also known as ‘Cable’, which accounts for 11% of FX, GBP/JPY, or the ‘Dragon’ as it is known by traders (3%), and EUR/GBP (2%). The Pound Sterling is issued by the Bank of England (BoE).
The single most important factor influencing the value of the Pound Sterling is monetary policy decided by the Bank of England. The BoE bases its decisions on whether it has achieved its primary goal of “price stability” – a steady inflation rate of around 2%. Its primary tool for achieving this is the adjustment of interest rates. When inflation is too high, the BoE will try to rein it in by raising interest rates, making it more expensive for people and businesses to access credit. This is generally positive for GBP, as higher interest rates make the UK a more attractive place for global investors to park their money. When inflation falls too low it is a sign economic growth is slowing. In this scenario, the BoE will consider lowering interest rates to cheapen credit so businesses will borrow more to invest in growth-generating projects.
Data releases gauge the health of the economy and can impact the value of the Pound Sterling. Indicators such as GDP, Manufacturing and Services PMIs, and employment can all influence the direction of the GBP. A strong economy is good for Sterling. Not only does it attract more foreign investment but it may encourage the BoE to put up interest rates, which will directly strengthen GBP. Otherwise, if economic data is weak, the Pound Sterling is likely to fall.
Another significant data release for the Pound Sterling is the Trade Balance. This indicator measures the difference between what a country earns from its exports and what it spends on imports over a given period. If a country produces highly sought-after exports, its currency will benefit purely from the extra demand created from foreign buyers seeking to purchase these goods. Therefore, a positive net Trade Balance strengthens a currency and vice versa for a negative balance.
Author

Akhtar Faruqui
FXStreet
Akhtar Faruqui is a Forex Analyst based in New Delhi, India. With a keen eye for market trends and a passion for dissecting complex financial dynamics, he is dedicated to delivering accurate and insightful Forex news and analysis.


