GBP/USD Price Forecast: Bulls need 1.3560 to unlock 1.3600
- GBP/USD holds sideways, but upside bias survives above 1.3406.
- Break above 1.3558 opens the path toward 1.3600.
- Failure below 1.3500 risks a pullback toward key SMA support.

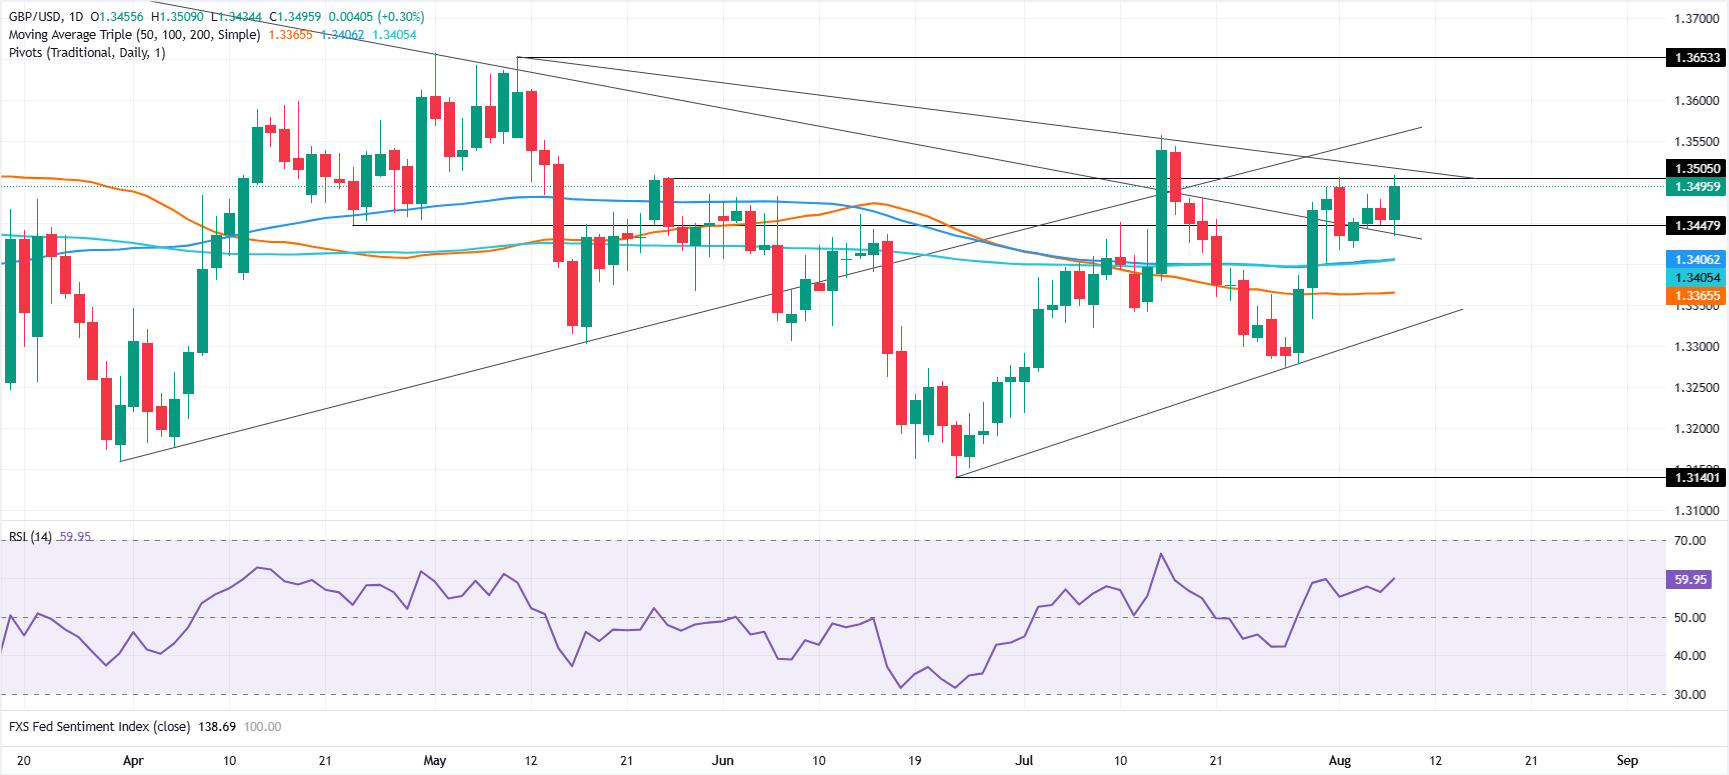
The Pound Sterling (GBP) edges higher by some 0.29% against the US Dollar (USD) on Friday, yet it remains trading sideways, unable to decisively crack 1.3500 after reaching a three-week peak of 1.3509, and has retreated to the 1.3490 area.
GBP/USD Price Forecast: Technical outlook
The technical picture shows that GBP/USD is consolidating, yet it is slightly tilted to the upside after clearing the 200-day Simple Moving Average (SMA) at 1.3406. Market structure suggests the uptrend might resume once buyers reclaim the July 15 swing high at 1.3558, opening the door to a test of 1.3600.
In that scenario, the next area of interest for GBP/USD would be the May 11 swing high at 1.3653, followed by 1.3700.
On the flip side, if GBP/USD remains below 1.3500, look for a pullback towards August’s 3 low of the day at 1.3417. A breach of the latter will expose the convergence of the 100- and 200-day SMAs at 1.3406/05, followed by the 50-day SMA at 1.3365.
GBP/USD Price Chart – Daily
Pound Sterling Price This week
The table below shows the percentage change of British Pound (GBP) against listed major currencies this week. British Pound was the strongest against the Swiss Franc.
| USD | EUR | GBP | JPY | CAD | AUD | NZD | CHF | |
|---|---|---|---|---|---|---|---|---|
| USD | -0.12% | -0.01% | 0.24% | -0.54% | -0.38% | 0.13% | 0.13% | |
| EUR | 0.12% | 0.11% | 0.38% | -0.41% | -0.15% | 0.28% | 0.26% | |
| GBP | 0.01% | -0.11% | -0.06% | -0.53% | -0.27% | 0.14% | 0.14% | |
| JPY | -0.24% | -0.38% | 0.06% | -0.72% | -0.48% | -0.01% | -0.02% | |
| CAD | 0.54% | 0.41% | 0.53% | 0.72% | 0.25% | 0.72% | 0.68% | |
| AUD | 0.38% | 0.15% | 0.27% | 0.48% | -0.25% | 0.40% | 0.40% | |
| NZD | -0.13% | -0.28% | -0.14% | 0.00% | -0.72% | -0.40% | 0.00% | |
| CHF | -0.13% | -0.26% | -0.14% | 0.02% | -0.68% | -0.40% | -0.00% |
The heat map shows percentage changes of major currencies against each other. The base currency is picked from the left column, while the quote currency is picked from the top row. For example, if you pick the British Pound from the left column and move along the horizontal line to the US Dollar, the percentage change displayed in the box will represent GBP (base)/USD (quote).
Author

Christian Borjon Valencia
FXStreet
Markets analyst, news editor, and trading instructor with over 14 years of experience across FX, commodities, US equity indices, and global macro markets.