|

GBP/USD Price Analysis: Slumps for four days as high US bond yields bolster USD

  • GBP/USD drops to 1.2458 and puts the 200-day Moving Average at 1.2424 in focus.
  • Short-term outlook shows the pair eyeing the week’s low at 1.2455, with a breach potentially targeting the S2 daily pivot at 1.2413.
  • A reclaim of the 1.2500 level could signal a bullish reversal, with the next resistance at the 200-hour Moving Average at 1.2593.

The Pound Sterling (GBP) extended its free fall for four straight days versus the US Dollar (USD) due to high US bond yields underpinning the Greenback. The GBP/USD is trading at 1.2458 after hitting a daily high of 1.2514, as sellers set their sights on technical support to prolong their profits.

GBP/USD Price Analysis: Technical outlook

After breaking an upslope support trendline drawn from around May lows, the major dropped below the psychological 1.2500 figure, which exposed the 200-day Moving Average (DMA) at 1.2424. A breach of the latter would shift the pair’s bias to neutral downwards and expose the May 25 swing low at 1.2308, a crucial support area. That could break the uptrend market structure and pave the way for further losses.

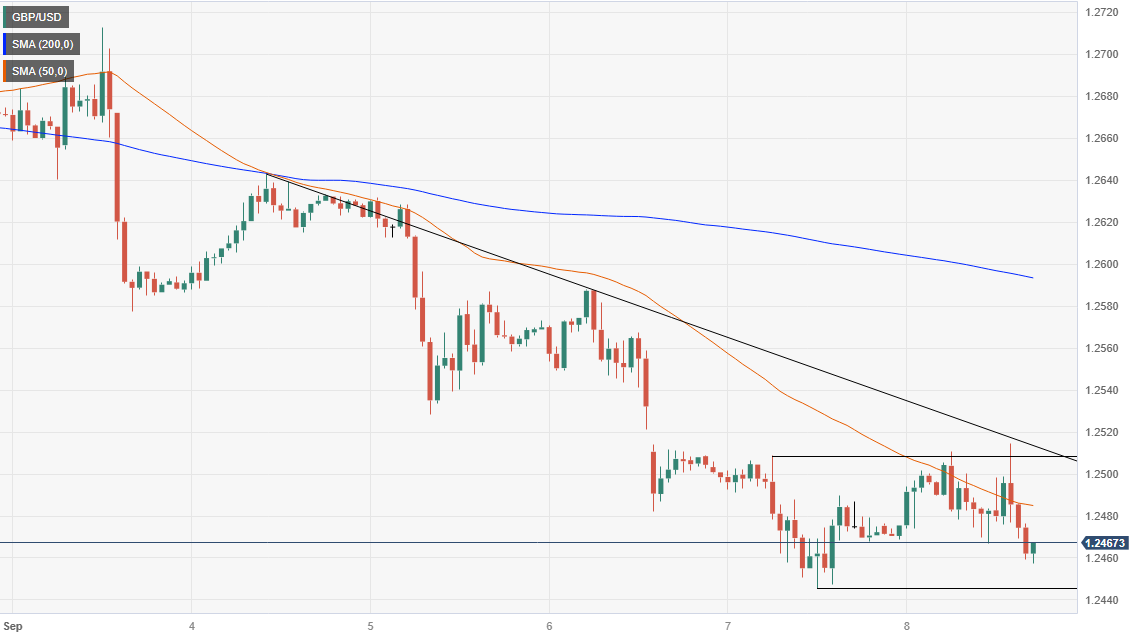
Short-term, the GPB/USD hourly chart shows an attempt by buyers to reclaim the 1.2500 figure. AS buyers failed, the pair dived towards the session’s lows, below Friday’s central pivot point, eyeing the week’s low at 1.2455. A breach of the latter could expose the S2 daily pivot at 1.2413, followed by the 1.2400 mark. Conversely, if traders reclaim 1.2500, that could open the door for further upside, with traders eyeing the 200-hour Moving Average (HMA) at 1.2593 before challenging 1.2600.

GBP/USD Price Action – Hourly chart

GBP/USD

GBP/USD

Overview
Today last price1.2463
Today Daily Change-0.0009
Today Daily Change %-0.07
Today daily open1.2472
 
Trends
Daily SMA201.2655
Daily SMA501.2766
Daily SMA1001.2655
Daily SMA2001.2426
 
Levels
Previous Daily High1.2509
Previous Daily Low1.2446
Previous Weekly High1.2746
Previous Weekly Low1.2563
Previous Monthly High1.2841
Previous Monthly Low1.2548
Daily Fibonacci 38.2%1.247
Daily Fibonacci 61.8%1.2485
Daily Pivot Point S11.2442
Daily Pivot Point S21.2413
Daily Pivot Point S31.2379
Daily Pivot Point R11.2505
Daily Pivot Point R21.2539
Daily Pivot Point R31.2568

Author

Christian Borjon Valencia

Christian Borjon began his career as a retail trader in 2010, mainly focused on technical analysis and strategies around it. He started as a swing trader, as he used to work in another industry unrelated to the financial markets.

More from Christian Borjon Valencia
Share:

Markets move fast. We move first.

Orange Juice Newsletter brings you expert driven insights - not headlines. Every day on your inbox.

By subscribing you agree to our Terms and conditions.

Editor's Picks

EUR/USD under pressure around 1.1700 after German inflation

EUR/USD loses its traction and declines toward 1.1700 after climbing to the 1.1750 area in the early European session. The mixed market mood helps the US Dollar (USD) hold its ground and makes it difficult for the pair to gather recovery momentum. Encouraging German inflation data did little to help the Euro.

GBP/USD retreats from three-month-high, holds above 1.3500

GBP/USD struggles to build on Monday's gains and trades in the red below 1.3550 after setting a new three-month-high near 1.3570. Ahead of this week's key employment data releases from the US, investors refrain from betting on a persistent US Dollar (USD) weakness and limit the pair's upside.

Gold corrects from weekly high, trades comfortably above $4,400

Gold eases from the weekly high it set at $4,475 but clings to modest gains above $4,450 in the second half of the day on Tuesday. While a rebound in the US Dollar caps the yellow metal's upside, heightened political tensions allow XAU/USD to keep its footing.

Render price surpasses $1.2 billion market cap as rally accelerates

Render continues its rally, trading above $2.36 on Tuesday after surging more than 50% last week. This price rally pushed RENDER’s market capitalization above $1.2 billion, surpassing that of other popular altcoins, such as Cosmos and Filecoin.

Implications of US intervention in Venezuela

Events in Venezuela are top of mind for market participants, and while developments are associated with an elevated degree of uncertainty, we are not making any changes to our markets or economic forecasts as a result of the deposition of Nicolás Maduro. 

Solana Price Forecast: SOL climbs above $137 as spot ETF demand accelerates

Solana (SOL) price extends gains above $137 at the time of writing on Tuesday, up more than 7% in the previous week. Institutional demand for SOL continues to strengthen, as spot exchange-traded funds recorded positive flows of more than $16 million on Monday.