- A modest USD profit-taking assisted GBP/USD to reverse an intraday dip to sub-1.3600 levels.
- Acceptance below 200-day SMA might have already set the stage for a further near-term decline.
- Any attempted recovery move is more likely to remain capped near the 1.3700 round-figure mark.
The GBP/USD pair once again showed some resilience below the 1.3600 mark and quickly recovered around 40-50 pips from the daily swing lows. The pair climbed back closer to the top end of its daily trading range, though lacked any follow-through buying and was last seen hovering around the 1.3630 region.
A generally positive risk tone – as depicted by a strong follow-through rally in the equity markets – prompted some profit-taking around the safe-haven US dollar. This, in turn, was seen as a key factor that extended some support to the GBP/USD pair. That said, the impasse over the Northern Ireland Protocol of the Brexit deal, along with the resurgence of the COVID-19 infections in the UK acted as a headwind for the British pound and capped gains.
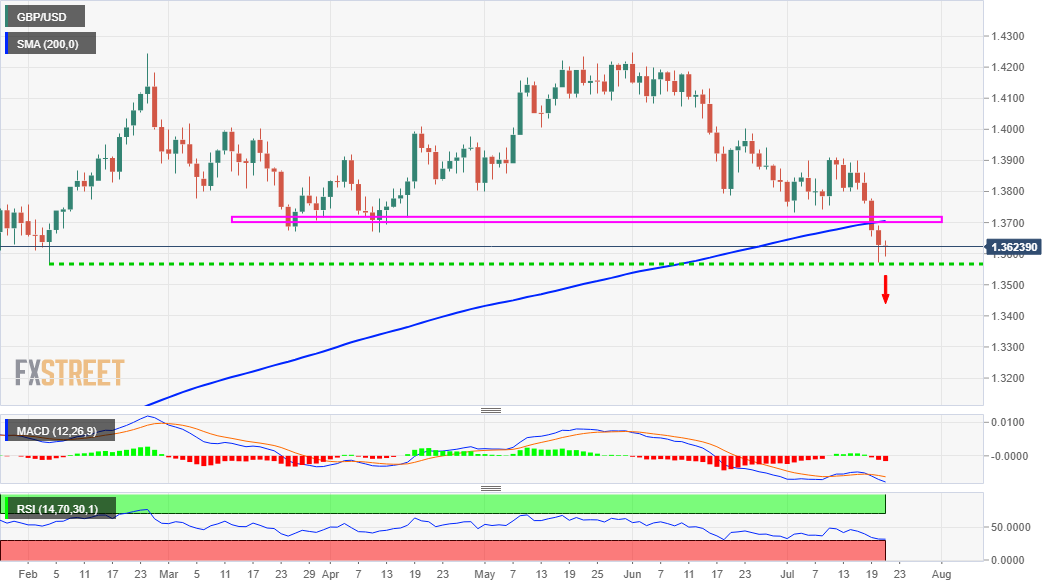
From a technical perspective, the GBP/USD pair has found acceptance below the very important 200-day SMA for the first time since July 2020 and seems vulnerable to slide further. The pair, however, managed to find some support just ahead of February 2021 on Tuesday. This, coupled with the fact that RSI (14) on the daily chart has moved on the verge of breaking into the oversold territory, warrants some caution for aggressive bearish traders.
Hence, it will be prudent to wait for some consolidation or a modest bounce before positioning for any further depreciating move. In the meantime, any attempted recovery move might be seen as a selling opportunity and runs the risk of fizzling out rather quickly near the 1.3700 mark. This coincides with the 200-DMA support breakpoint and should now act as a key pivotal point and help determine the next leg of a directional move for the GBP/USD pair.
On the flip side, the 1.3570-60 region seems to have emerged as immediate support. A convincing break below will be seen as a fresh trigger for bearish traders and prompt some technical selling. The GBP/USD pair might then accelerate the fall further towards the key 1.3500 psychological mark. The downward trajectory could further get extended towards the next relevant support near the 1.3450-30 horizontal zone.
GBP/USD daily chart
Technical levels to watch
Information on these pages contains forward-looking statements that involve risks and uncertainties. Markets and instruments profiled on this page are for informational purposes only and should not in any way come across as a recommendation to buy or sell in these assets. You should do your own thorough research before making any investment decisions. FXStreet does not in any way guarantee that this information is free from mistakes, errors, or material misstatements. It also does not guarantee that this information is of a timely nature. Investing in Open Markets involves a great deal of risk, including the loss of all or a portion of your investment, as well as emotional distress. All risks, losses and costs associated with investing, including total loss of principal, are your responsibility. The views and opinions expressed in this article are those of the authors and do not necessarily reflect the official policy or position of FXStreet nor its advertisers. The author will not be held responsible for information that is found at the end of links posted on this page.
If not otherwise explicitly mentioned in the body of the article, at the time of writing, the author has no position in any stock mentioned in this article and no business relationship with any company mentioned. The author has not received compensation for writing this article, other than from FXStreet.
FXStreet and the author do not provide personalized recommendations. The author makes no representations as to the accuracy, completeness, or suitability of this information. FXStreet and the author will not be liable for any errors, omissions or any losses, injuries or damages arising from this information and its display or use. Errors and omissions excepted.
The author and FXStreet are not registered investment advisors and nothing in this article is intended to be investment advice.
Recommended content
Editors’ Picks
EUR/USD trades weak below 1.0800 amid Good Friday lull, ahead of US PCE
EUR/USD remains depressed below 1.0800, as traders lack directional impetus amid minimal volatility and thin liquidity on Good Friday. The pair keenly awaits the US PCE inflation data and Fed Chair Powell's speech for fresh hints on next week's price action.
GBP/USD holds steady above 1.2600 as markets stay calm on Good Friday
GBP/USD trades sideways above 1.2600 amid a typical Good Friday trading lull. A broadly firmer US Dollar could keep any upside attempts limited in the pair ahead of the US PCE inflation data and Fed Chair Powell's appearance.
Gold ends Q1 2024 at record highs, what’s next?
Gold is sitting at an all-time high of $2,236, lacking a trading impetus amid holiday-thinned conditions on Good Friday. Most major world markets, including the United States are closed in observance of Holy Friday, leaving volatility around Gold price highly subdued.
Ripple's move above this key level could trigger nearly 50% rally for XRP
Ripple price has overcome a critical resistance level and flipped into a support floor on the weekly time frame. This development happened while XRP tightly consolidated for roughly 250 days.
US core PCE inflation set to ease in February on month as Federal Reserve rate cut bets for June mount
The core Personal Consumption Expenditures Price Index is set to rise 0.3% MoM and 2.8% YoY in February. The revised Summary of Projections showed that policymakers upwardly revised end-2024 core PCE forecast to 2.6% from 2.4%.