|

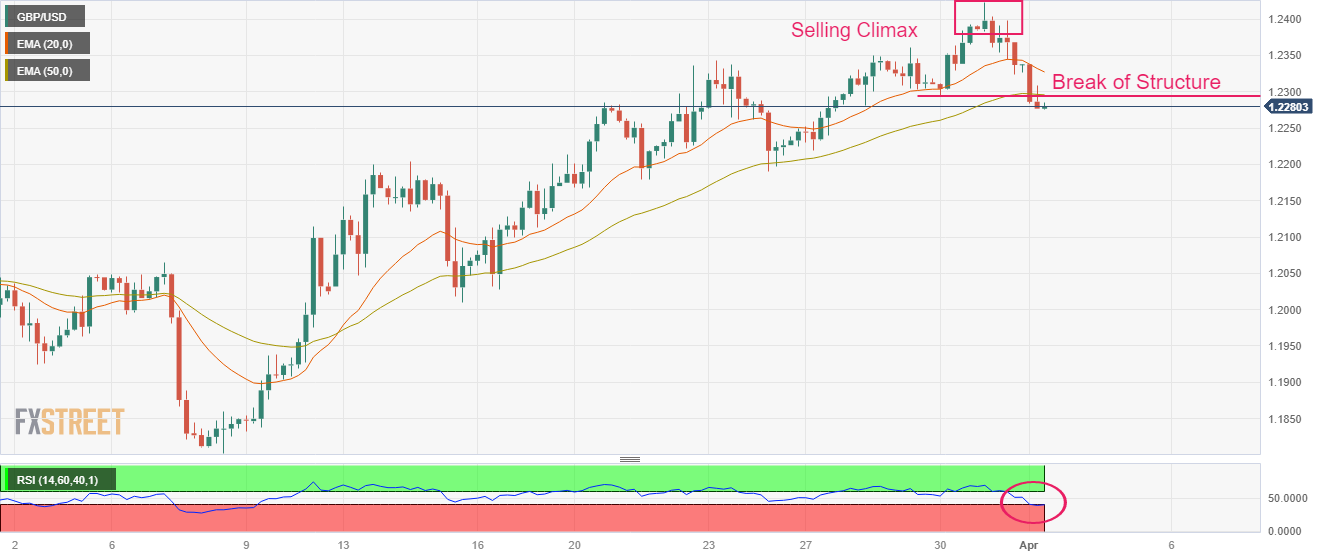
GBP/USD Price Analysis: Bumpy ride ahead on a break of structure below 1.2300

  • GBP/USD has faced barricades near 1.2300 after an attempt of recovery.
  • S&P500 futures are holding onto losses generated in the Asian session, portraying a cautious market mood.
  • The USD Index has refreshed its weekly high above 103.00 as higher US inflation expectations were prompted by upbeat oil prices.

The GBP/USD pair has slipped sharply below the round-level support of 1.2300 in the Asian session. The Cable went through turbulent times as investors shifted their funds into the US Dollar Index (DXY) in hopes that the Federal Reserve (Fed) will hike rates further dramatically.

The USD Index has refreshed its weekly high above 103.00 as higher United States inflation expectations were prompted by upbeat oil prices. Acceleration in the oil price is expected to fuel inflationary pressures as producers would offset the impact of costly oil by hiking prices of goods and services at factory gates.

S&P500 futures are holding onto losses generated in the Asian session, portraying a cautious market mood. The cable is expected to face sheer volatility ahead of the US ISM Manufacturing PMI data. The economic data provide cues about forward demand for goods, which is likely to contract firmly to 44.6 vs. the prior release of 47.00. Subdued consensus for the US Manufacturing PMI could be the outcome of higher interest rates by the Fed for bringing down persistent inflation.

GBP/USD started declining after observing the presence of responsive sellers around March 31 high at 1.2424. The higher High Higher Low structure in the GBP/USD pair has broken after slipping below March 30 low around 1.2300 and the Cable is expected to attract more downside bets ahead.

The Cable has also slipped firmly below the 20-and 50-period Exponential Moving Averages (EMAs) at 1.2327 and 1.2300 respectively, which indicates that the short-term trend has turned bearish.

Also, the Relative Strength Index (RSI) (14) has slipped into the bearish range of 20.00-40.00, which indicates that the downside momentum has been triggered.

Going forward, a break below March 23 low at 1.2261 will accelerate the downside in the Cable toward the round-level support at 1.2200 and March 10 high at 1.2113.

Alternatively, a move above March 29 high at 1.2362 would drive the Cable toward March 31 high at 1.2424 followed by the psychological resistance at 1.2500.

GBP/USD four-hour chart
GBP/USD

Overview
Today last price1.2279
Today Daily Change-0.0059
Today Daily Change %-0.48
Today daily open1.2338
 
Trends
Daily SMA201.2163
Daily SMA501.2149
Daily SMA1001.213
Daily SMA2001.1895
 
Levels
Previous Daily High1.2424
Previous Daily Low1.2324
Previous Weekly High1.2424
Previous Weekly Low1.2219
Previous Monthly High1.2424
Previous Monthly Low1.1803
Daily Fibonacci 38.2%1.2362
Daily Fibonacci 61.8%1.2386
Daily Pivot Point S11.23
Daily Pivot Point S21.2262
Daily Pivot Point S31.2201
Daily Pivot Point R11.2399
Daily Pivot Point R21.2461
Daily Pivot Point R31.2499

Author

Sagar Dua

Sagar Dua

FXStreet

Sagar Dua is associated with the financial markets from his college days. Along with pursuing post-graduation in Commerce in 2014, he started his markets training with chart analysis.


More from Sagar Dua
Share:

Editor's Picks

GBP/USD dips below 1.3350 with bullish momentum losing steam

The British Pound ticks lower against the US Dollar Monday, attempting to close a seven-day rally, as tensions rise again in the Strait of Hormuz, one of the critical points in the peace process between Washington and Tehran. The GBP/USD pair trades near 1.3340 at the time of writing, down from 1.3387 highs last week, although it maintains a near-term bullish trend intact.

EUR/USD drops toward 1.1400 as US Dollar rebounds

EUR/USD pair trades marginally lower, heading toward 1.1400 in the European session on Monday. The pair faces slight selling pressure as the US Dollar gains ground after a negative weekly close. Middle East concerns and the USD/JPY rally support the Greenback.

Gold sticks to modest losses amid Hormuz risks; lacks bearish conviction

Gold shows some resilience below the $4,150 level, and for now seems to have stalled its intraday retracement slide from a two-week high, levels just above the $4,200 mark, touched earlier this Monday. The commodity, however, retains its negative bias heading into the European session, seems to have snapped a three-day winning streak.

Dogecoin recovery stalls amid early signs of whale support

Dogecoin (DOGE) price nears $0.0770, maintaining a broadly consolidative tone for the last three days after Friday’s 4% rebound. The first-ever meme coin is losing retail interest as DOGE derivatives volume drops, while on-chain data shows early signs that large-wallet investors, commonly referred to as whales, are expanding their holdings.

Week ahead – ISM services PMI and Fed Minutes to shake Fed hike bets
The US dollar is finishing the week on the back foot against most of its major counterparts this week, losing the most ground against the kiwi, the franc and the pound. Despite the pullback, investors remained adamant in their view that the Fed may have to press the rate hike button before the turn of the year.
Kevin Warsh offers no policy clues: Why markets still got their answer

Financial markets came to Sintra looking for clues about the Federal Reserve's (Fed) next move. They largely left with confirmation that Fed Chair Kevin Warsh intends to make those clues much harder to find.














