GBP/JPY Price Forecast: Retreats below 193.50 after struggling near 195.00
- GBP/JPY falls to 193.28, ending three-day rally after failing to surpass 195.00 and 200-day SMA at 194.18.
- Trading sideways; support at 193.23 (100-day SMA) and 192.28 (Senkou Span B) maintains range-bound status.
- Break below 192.28 could target 191.83 (Tenkan-sen); push above 194.89 may challenge 195.00 resistance.

The GBP/JPY retreats after rallying for three straight trading days since last Friday. However, it struggled to clear the 195.00 figure and the 200-day Simple Moving Average (SMA), which exacerbated a drop in the cross pair beneath the 193.50 area. At the time of writing, the pair hovers near 193.28, virtually unchanged.
GBP/JPY Price Forecast: Technical outlook
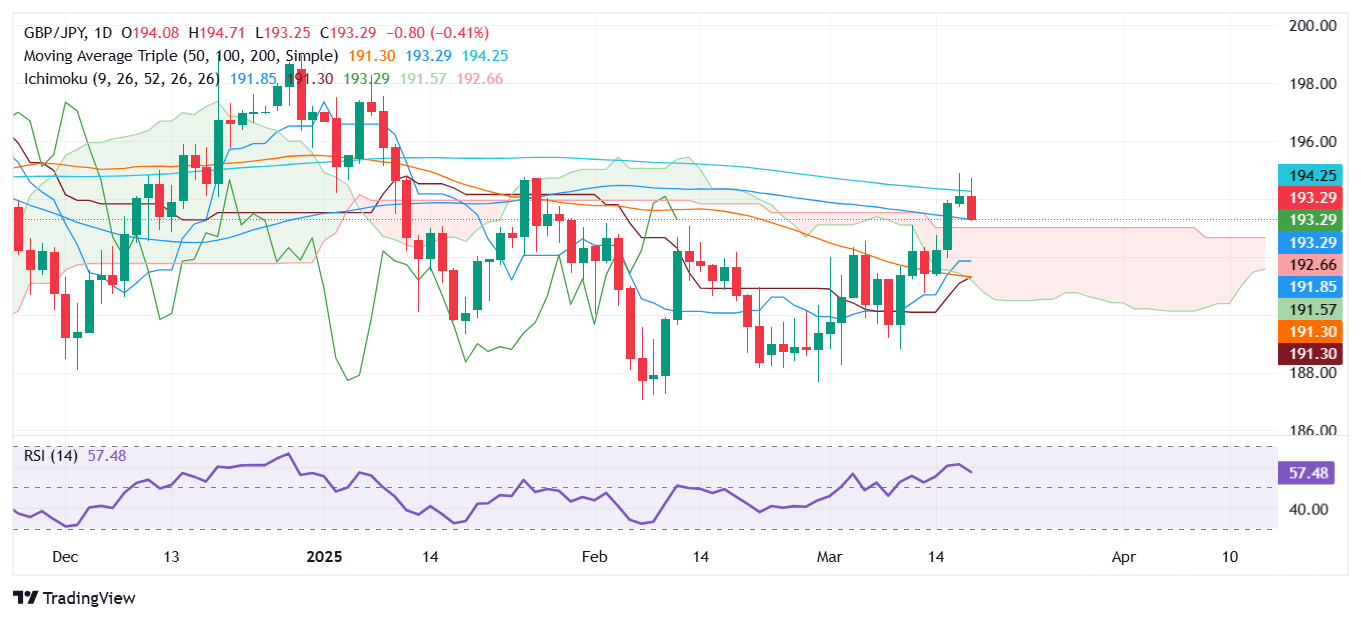
The GBP/JPY trades sideways for the second straight day, capped on the downside by the 100-day Simple Moving Average (SMA) at 193.23 and the Senkou Span B near 192.28. On the top side, the 200-day SMA at 194.18 would likely keep the pair trading range bound.
Additionally, despite being bullish, the Relative Strength Index (RSI) is flat. Hence, buyers and sellers lack the strength to break the trading range.
If GBP/JPY falls below 192.28, the next support would be the Tenkan-sen at 191.83, followed by the Kijun-sen at 191.24. Conversely, if GBP/JPY climbs past the 200-day SMA, the next resistance would be the March 18 peak at 194.89, ahead of 195.00.
GBP/JPY Price Chart – Daily
British Pound PRICE This week
The table below shows the percentage change of British Pound (GBP) against listed major currencies this week. British Pound was the strongest against the US Dollar.
| USD | EUR | GBP | JPY | CAD | AUD | NZD | CHF | |
|---|---|---|---|---|---|---|---|---|
| USD | -0.28% | -0.54% | -0.10% | -0.44% | -0.46% | -1.27% | -0.94% | |
| EUR | 0.28% | -0.38% | -0.21% | -0.15% | -0.31% | -1.00% | -0.68% | |
| GBP | 0.54% | 0.38% | 0.48% | 0.02% | 0.05% | -0.63% | -0.37% | |
| JPY | 0.10% | 0.21% | -0.48% | -0.34% | -0.56% | -1.12% | -0.96% | |
| CAD | 0.44% | 0.15% | -0.02% | 0.34% | -0.20% | -0.82% | -1.05% | |
| AUD | 0.46% | 0.31% | -0.05% | 0.56% | 0.20% | -0.67% | -0.35% | |
| NZD | 1.27% | 1.00% | 0.63% | 1.12% | 0.82% | 0.67% | 0.32% | |
| CHF | 0.94% | 0.68% | 0.37% | 0.96% | 1.05% | 0.35% | -0.32% |
The heat map shows percentage changes of major currencies against each other. The base currency is picked from the left column, while the quote currency is picked from the top row. For example, if you pick the British Pound from the left column and move along the horizontal line to the US Dollar, the percentage change displayed in the box will represent GBP (base)/USD (quote).
Author

Christian Borjon Valencia
FXStreet
Markets analyst, news editor, and trading instructor with over 14 years of experience across FX, commodities, US equity indices, and global macro markets.


