GBP/JPY Price Forecast: Rebounds after hammer, eyes on 200-day SMA breakout
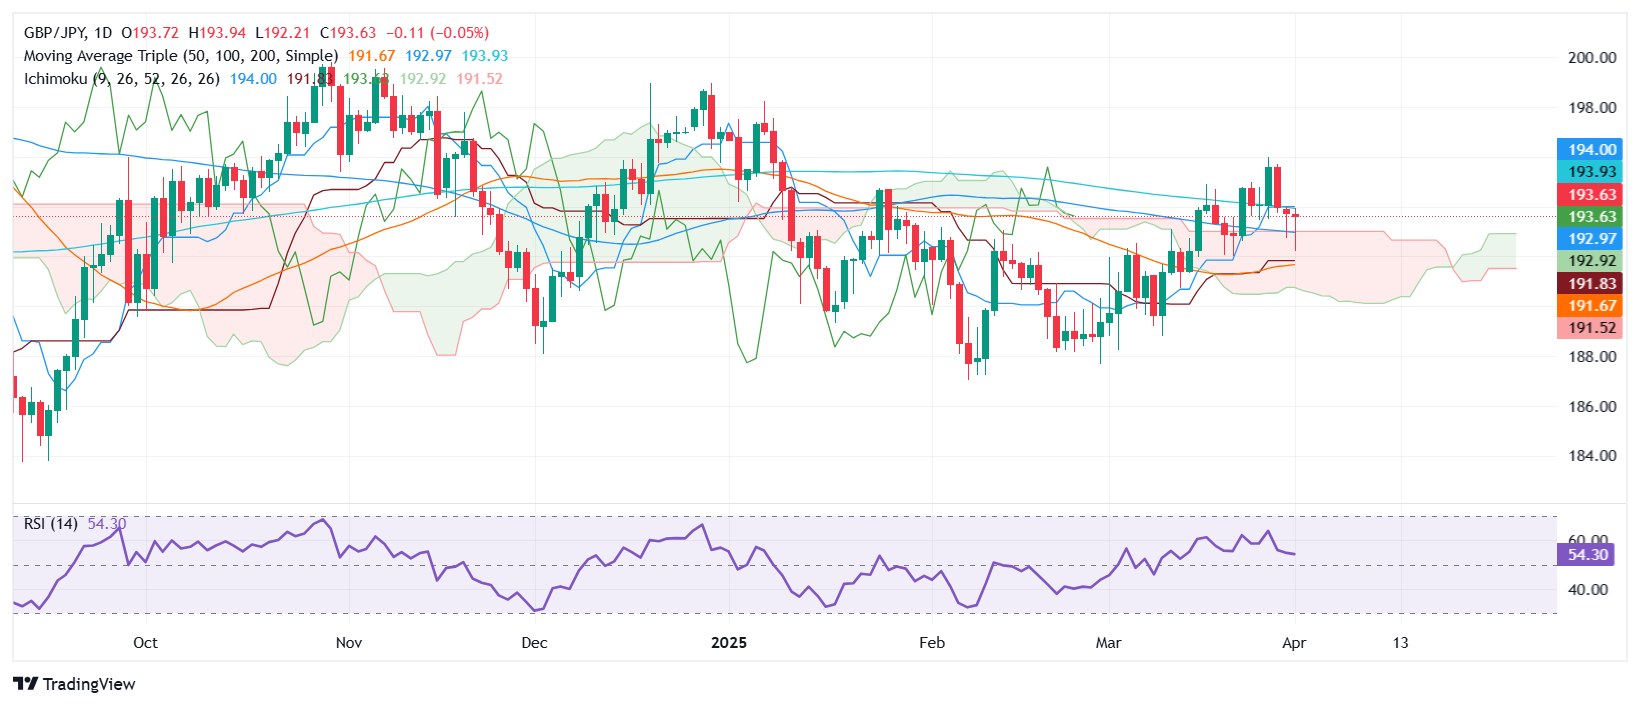
- GBP/JPY forms bullish hammer at 192.19 within Ichimoku Cloud, hinting at potential reversal.
- RSI trends upward, suggesting decreasing bearish momentum and increased buying interest in early Asian trade.
- A break above 200-day SMA at 193.87 may lead to 194.00 and March peak at 195.71; watch for downside risk below 193.00.

The GBP/JPY begins Wednesday’s Asian session on a positive note, after posting losses of 0.22% on Tuesday, as investors grew risk-averse due to US trade policies. At the time of writing, the pair trades at 193.64, below the 200-day Simple Moving Average (SMA), which registers gains of 0.21%.
GBP/JPY Price Forecast: Technical outlook
The GBP/JPY shows a neutral upward biased, as buyers regained strength towards the end of Tuesday’s session. The pair formed a ‘hammer’ pattern after reaching a weekly low of 192.19, positioned comfortably within the Ichimoku Cloud (Kumo), before reversing direction and recovering some of its losses.
The Relative Strength Index (RSI) shows that sellers are losing steam and buyers are regaining control. The RSI is bullish and is aiming upward, indicating a resumption of the uptrend.
That said, GBP/JPY’s first resistance is the 200-day SMA at 193.87. A breach of the latter will expose 194, alongside the March 28 peak of 195.71. Conversely, if GBP/JPY tumbles below the confluence of the top of the Kumo and the 100-day SMA around 192.89/193.00, this could exacerbate a retest of 191.81, where the Kijun-sen lies, followed by the 50-day SMA at 191.63.
GBP/JPY Price Chart – Daily
Pound Sterling FAQs
The Pound Sterling (GBP) is the oldest currency in the world (886 AD) and the official currency of the United Kingdom. It is the fourth most traded unit for foreign exchange (FX) in the world, accounting for 12% of all transactions, averaging $630 billion a day, according to 2022 data. Its key trading pairs are GBP/USD, also known as ‘Cable’, which accounts for 11% of FX, GBP/JPY, or the ‘Dragon’ as it is known by traders (3%), and EUR/GBP (2%). The Pound Sterling is issued by the Bank of England (BoE).
The single most important factor influencing the value of the Pound Sterling is monetary policy decided by the Bank of England. The BoE bases its decisions on whether it has achieved its primary goal of “price stability” – a steady inflation rate of around 2%. Its primary tool for achieving this is the adjustment of interest rates. When inflation is too high, the BoE will try to rein it in by raising interest rates, making it more expensive for people and businesses to access credit. This is generally positive for GBP, as higher interest rates make the UK a more attractive place for global investors to park their money. When inflation falls too low it is a sign economic growth is slowing. In this scenario, the BoE will consider lowering interest rates to cheapen credit so businesses will borrow more to invest in growth-generating projects.
Data releases gauge the health of the economy and can impact the value of the Pound Sterling. Indicators such as GDP, Manufacturing and Services PMIs, and employment can all influence the direction of the GBP. A strong economy is good for Sterling. Not only does it attract more foreign investment but it may encourage the BoE to put up interest rates, which will directly strengthen GBP. Otherwise, if economic data is weak, the Pound Sterling is likely to fall.
Another significant data release for the Pound Sterling is the Trade Balance. This indicator measures the difference between what a country earns from its exports and what it spends on imports over a given period. If a country produces highly sought-after exports, its currency will benefit purely from the extra demand created from foreign buyers seeking to purchase these goods. Therefore, a positive net Trade Balance strengthens a currency and vice versa for a negative balance.
Author

Christian Borjon Valencia
FXStreet
Markets analyst, news editor, and trading instructor with over 14 years of experience across FX, commodities, US equity indices, and global macro markets.


