USD/CHF Price Forecast: Bulls reclaim 0.8100 after SMA bounce
- USD/CHF snaps a two-day slide after defending 50-day SMA support.
- RSI crosses above neutral, confirming buyers regain near-term control.
- A break above 0.8150 exposes 0.8200 and the yearly high.

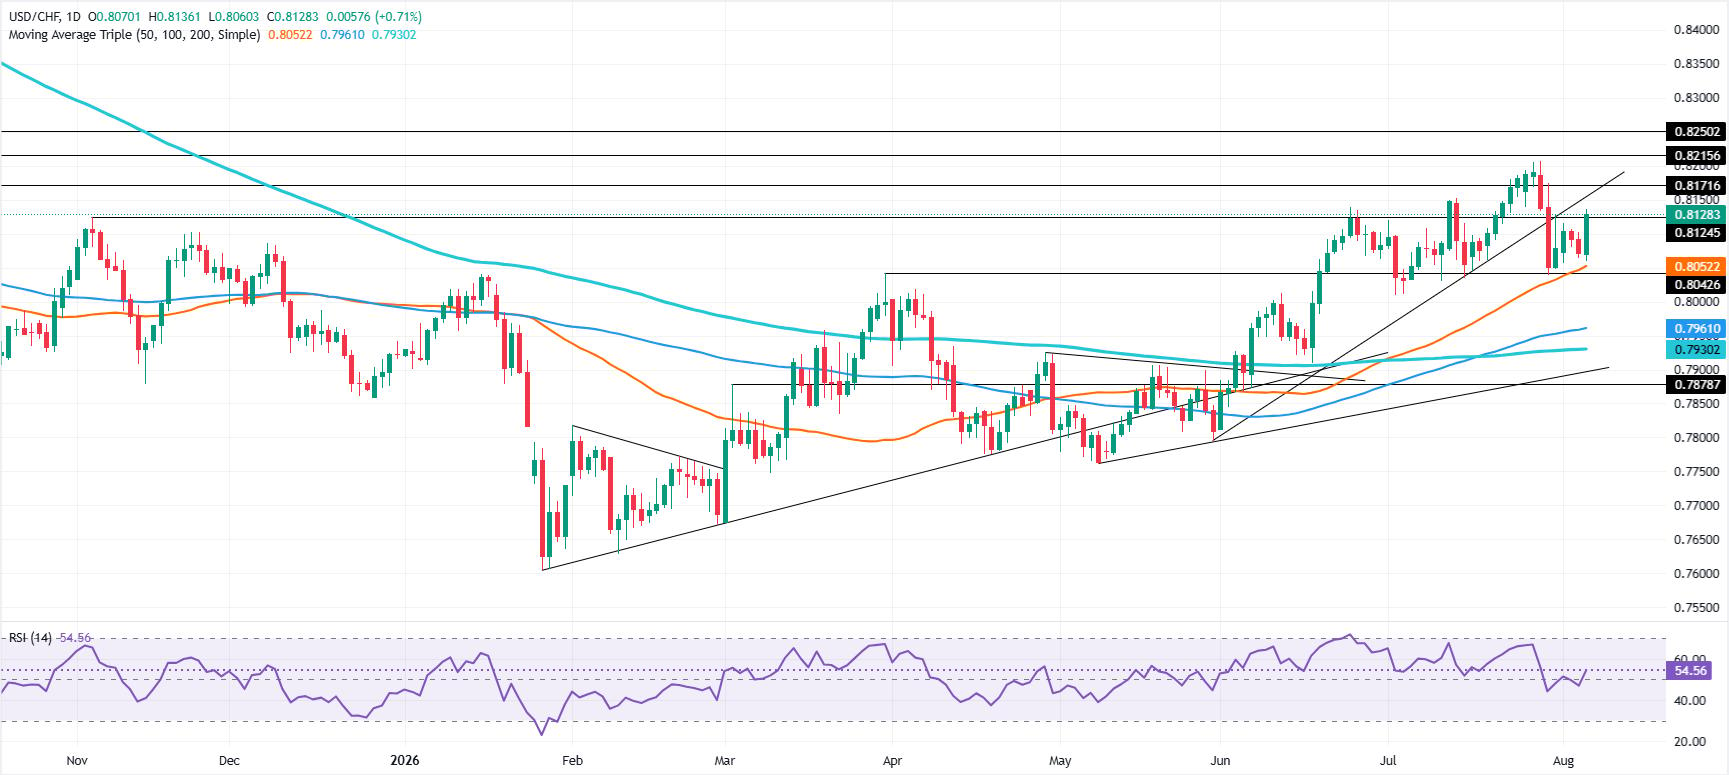
The USD/CHF pair snaps two days of losses and rises by over 0.60% on Thursday after solid US jobs data. Also, buyers stepped in at key support at the 50-day Simple Moving Average (SMA) of 0.8052, pushing the pair back above the 0.8100 threshold.
USD/CHF Price Forecast: Technical outlook
USD/CHF uptrend remains intact, with the market structure of higher highs and higher lows continuing to be respected. Also, momentum, as depicted in the Relative Strength Index (RSI), shows that buyers are in control, as the index crosses above its 50-neutral level.
Given the backdrop, the pair faces key resistance at 0.8150. Once breached, a move towards 0.8200 is on the cards. Above lies the yearly high of 0.8207, which, once cleared, would extend the USD/CHF rally towards the June 4, 2025, cycle high at 0.8250. Up next is 0.8300.
On the downside, the first support for USD/CHF would be at 0.8100. If spot prices fall below the 50-day SMA at 0.8052, the next floor level emerges at 0.8000.
USD/CHF Price Chart – Daily
Swiss Franc Price Today
The table below shows the percentage change of Swiss Franc (CHF) against listed major currencies today. Swiss Franc was the strongest against the Japanese Yen.
| USD | EUR | GBP | JPY | CAD | AUD | NZD | CHF | |
|---|---|---|---|---|---|---|---|---|
| USD | 0.30% | 0.11% | 0.44% | 0.06% | 0.39% | 0.34% | 0.69% | |
| EUR | -0.30% | -0.19% | 0.15% | -0.24% | 0.07% | 0.05% | 0.39% | |
| GBP | -0.11% | 0.19% | 0.34% | -0.06% | 0.26% | 0.22% | 0.59% | |
| JPY | -0.44% | -0.15% | -0.34% | -0.39% | -0.06% | -0.09% | 0.27% | |
| CAD | -0.06% | 0.24% | 0.06% | 0.39% | 0.33% | 0.31% | 0.65% | |
| AUD | -0.39% | -0.07% | -0.26% | 0.06% | -0.33% | -0.02% | 0.30% | |
| NZD | -0.34% | -0.05% | -0.22% | 0.09% | -0.31% | 0.02% | 0.38% | |
| CHF | -0.69% | -0.39% | -0.59% | -0.27% | -0.65% | -0.30% | -0.38% |
The heat map shows percentage changes of major currencies against each other. The base currency is picked from the left column, while the quote currency is picked from the top row. For example, if you pick the Swiss Franc from the left column and move along the horizontal line to the US Dollar, the percentage change displayed in the box will represent CHF (base)/USD (quote).
Author

Christian Borjon Valencia
FXStreet
Markets analyst, news editor, and trading instructor with over 14 years of experience across FX, commodities, US equity indices, and global macro markets.














