GBP/JPY Price Forecast: Possible Japan intervention caps gains near 216.00
- GBP/JPY eases from a two-month high as traders speculate on possible Japanese intervention.
- Markets remain alert for signs of intervention as Japan's Finance Ministry declines to comment.
- Technically, GBP/JPY maintains a bullish bias while holding above key moving averages.

GBP/JPY trades under pressure on Thursday as the Japanese Yen (JPY) strengthens across the board amid speculation that Japanese authorities may have intervened in the foreign exchange market after the Yen fell to a 40-year low against the US Dollar (USD) earlier this week.
At the time of writing, the cross is trading around 215, retreating from the two-month high of 216.08 touched during the Asian session.
According to Reuters, it was not immediately clear what drove the Yen's sharp rebound, and Japan's Ministry of Finance declined to comment. Some traders and strategists speculated that authorities had conducted a rate check.
Traders remain alert to the possibility of intervention by Japanese authorities. However, the downside in GBP/JPY could remain limited as investors continue to take advantage of Japan's relatively low interest rates compared with other major economies, supporting carry trades. From a technical perspective, the broader trend also remains tilted to the upside.
Technical Analysis:
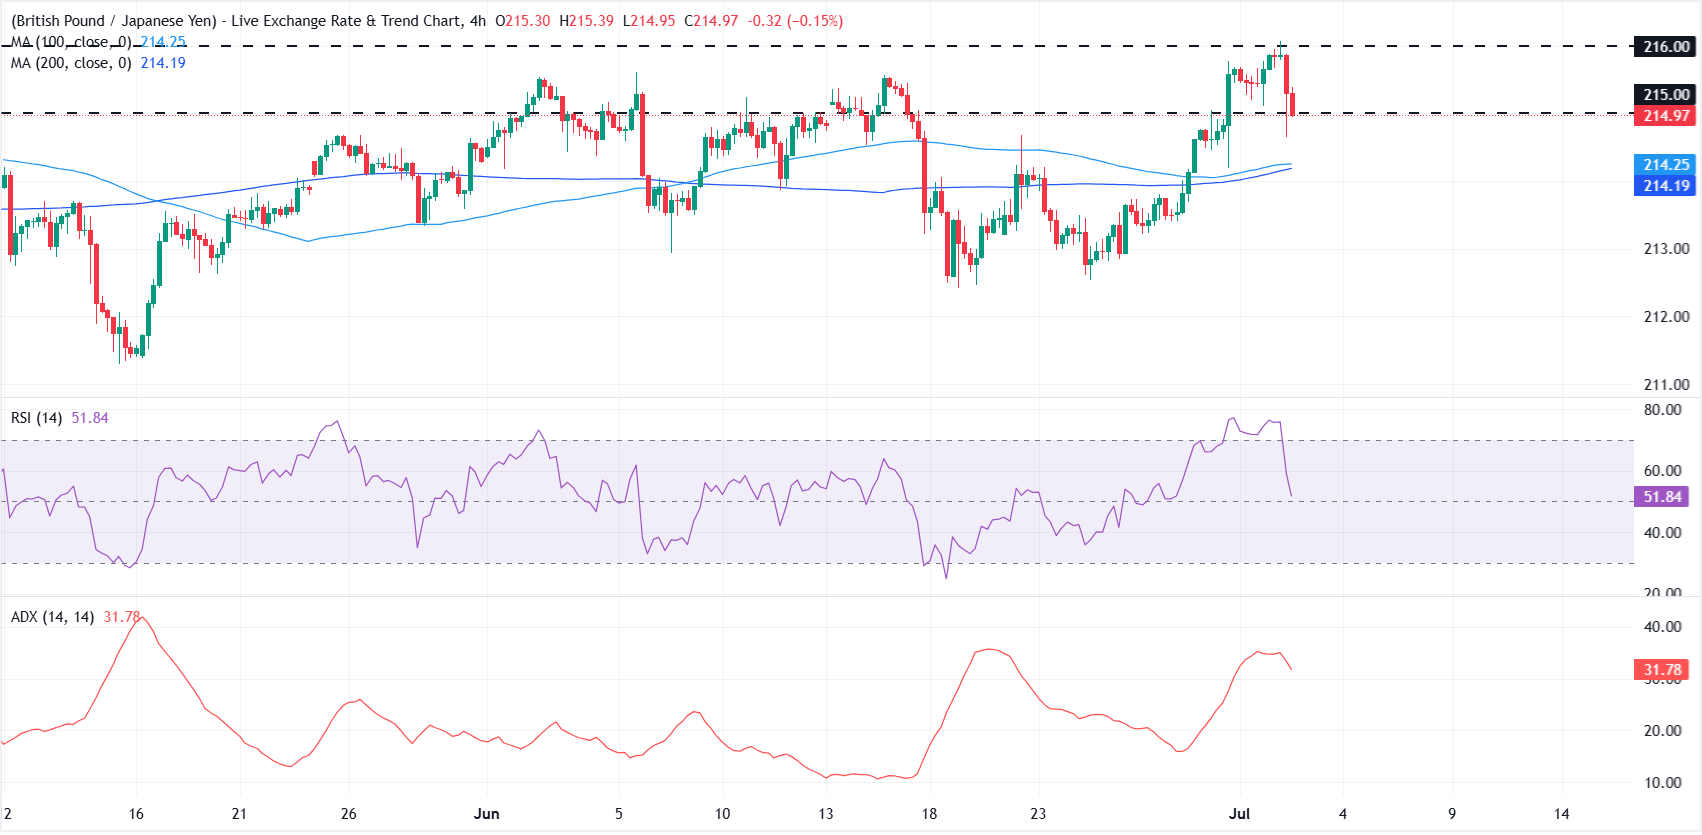
In the 4-hour chart, GBP/JPY holds a mildly bullish bias as it stays above the 100-period simple moving average (SMA) at 214.25 and the 200-period SMA at 214.19. The pair is also trading just over the horizontal support at 215, suggesting near-term demand on dips, while the Relative Strength Index (RSI) at 52 leans slightly positive and the Average Directional Index (ADX) at 31 hints at a moderately established trend rather than a volatile reversal phase.
On the topside, immediate resistance is seen at the horizontal barrier at 216, where a clear break would open the way for a continuation of the broader advance. On the downside, initial support is located at 215, followed by the clustered moving average zone between the 100-period SMA at 214.25 and the 200-period SMA at 214.19, before a deeper floor emerges at 213.
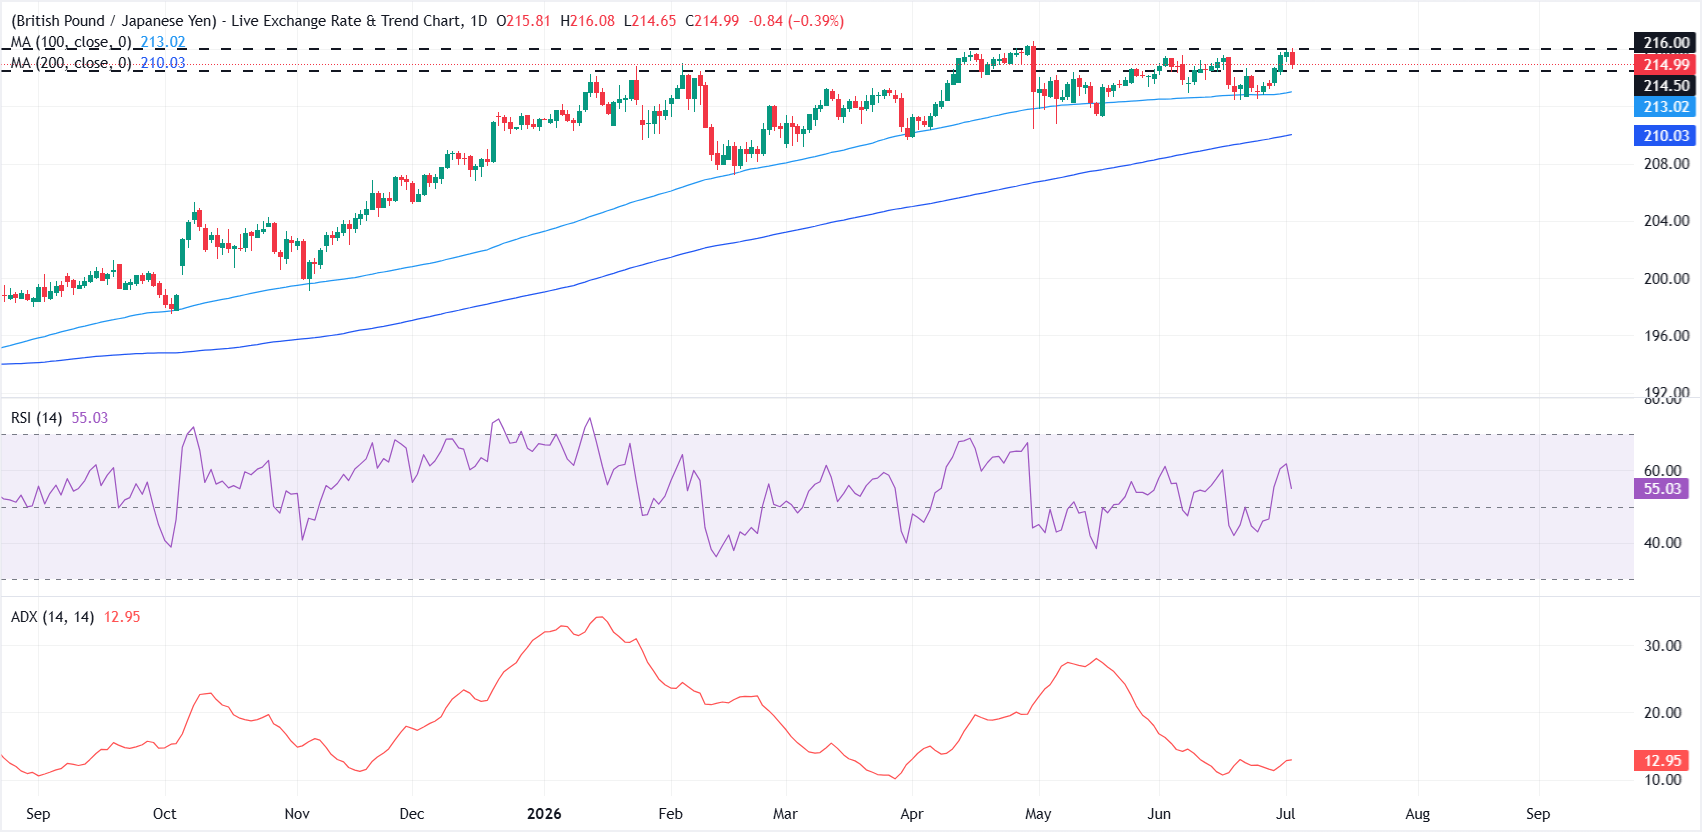
On the daily chart, GBP/JPY maintains a bullish near-term bias as it holds above both the 100-day and 200-day simple moving averages (SMAs) at 213.02 and 210.03 respectively. The pair is trading under the horizontal resistance at 216.00, while a mid-50s Relative Strength Index (RSI) suggests constructive momentum and the subdued Average Directional Index (ADX) around 13 hints at a trend that is firm but not strongly directional.
On the downside, initial support appears at 214.50, where a horizontal level underpins the latest advance, followed by the 100-day SMA at 213.02 and the 200-day SMA near 210.03. On the topside, a break above 216.00 would open the way for further gains, with the existing moving average structure reinforcing the broader supportive backdrop as long as price holds above 213.02.
(The technical analysis of this story was written with the help of an AI tool.)
Japanese Yen Price Today
The table below shows the percentage change of Japanese Yen (JPY) against listed major currencies today. Japanese Yen was the strongest against the Australian Dollar.
| USD | EUR | GBP | JPY | CAD | AUD | NZD | CHF | |
|---|---|---|---|---|---|---|---|---|
| USD | -0.23% | -0.28% | -0.68% | -0.00% | 0.05% | -0.02% | -0.35% | |
| EUR | 0.23% | -0.06% | -0.44% | 0.21% | 0.28% | 0.23% | -0.12% | |
| GBP | 0.28% | 0.06% | -0.39% | 0.24% | 0.33% | 0.28% | -0.07% | |
| JPY | 0.68% | 0.44% | 0.39% | 0.66% | 0.74% | 0.64% | 0.33% | |
| CAD | 0.00% | -0.21% | -0.24% | -0.66% | 0.06% | 0.01% | -0.34% | |
| AUD | -0.05% | -0.28% | -0.33% | -0.74% | -0.06% | -0.05% | -0.40% | |
| NZD | 0.02% | -0.23% | -0.28% | -0.64% | -0.01% | 0.05% | -0.35% | |
| CHF | 0.35% | 0.12% | 0.07% | -0.33% | 0.34% | 0.40% | 0.35% |
The heat map shows percentage changes of major currencies against each other. The base currency is picked from the left column, while the quote currency is picked from the top row. For example, if you pick the Japanese Yen from the left column and move along the horizontal line to the US Dollar, the percentage change displayed in the box will represent JPY (base)/USD (quote).
Author

Vishal Chaturvedi
FXStreet
I am a macro-focused research analyst with over four years of experience covering forex and commodities market. I enjoy breaking down complex economic trends and turning them into clear, actionable insights that help traders stay ahead of the curve.
















