EUR/JPY Price Forecast: SMAs confluence blocks bulls near 185.00
- EUR/JPY stalls near 184.70 despite two-day recovery attempt.
- SMA confluence at 184.72/73 caps immediate bullish momentum.
- Break above 185.00 exposes July high at 187.47.

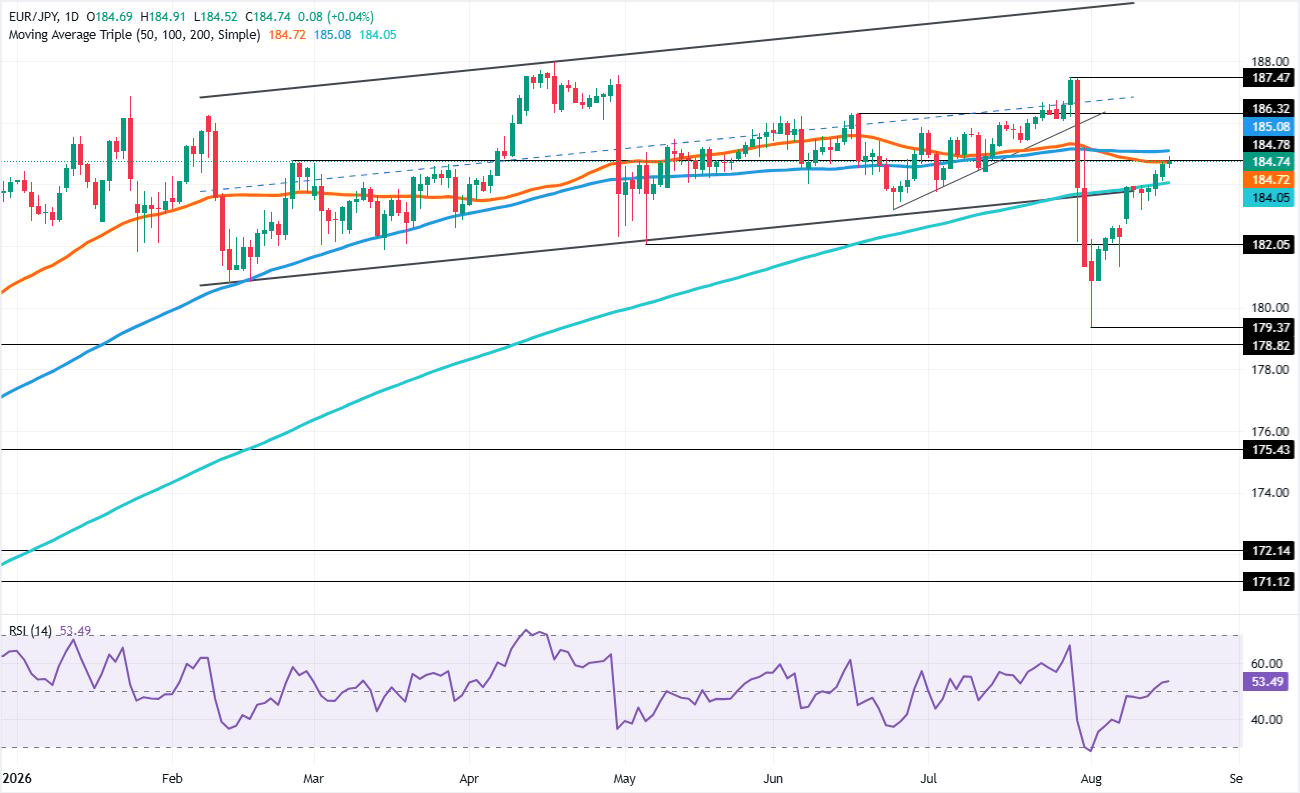
The EUR/JPY registers two consecutive days of gains, but on Tuesday, buyers failed to gain traction as they faced a confluence of key resistance levels near the 184.70 area. The cross-pair is poised to end the day unchanged, near its opening price of 184.69.
EUR/JPY Price Forecast: Technical Outlook
The cross is approaching the confluence of the 50- and 100-day Simple Moving Averages (SMAs) at around 184.72/73, with the 50-day SMA showing strong bullish momentum that could carry EUR/JPY past the 200-day SMA, which sits below the current spot price at 184.05.
A decisive break above the confluence of the 50- and 100-day SMAs opens the door to challenge 185.00. Once surpassed, the uptrend gains relevance, with traders eyeing the next cycle high at 187.47, the July 29 high.
On the flip side, the first support for EUR/JPY is the 200-day SMA at 184.05. Once surpassed, the next area of interest would be the May 6 swing low of 182.05, followed by the August 3 low of 179.37.
EUR/JPY Price Chart – Daily
Japanese Yen Price Today
The table below shows the percentage change of Japanese Yen (JPY) against listed major currencies today. Japanese Yen was the strongest against the New Zealand Dollar.
| USD | EUR | GBP | JPY | CAD | AUD | NZD | CHF | |
|---|---|---|---|---|---|---|---|---|
| USD | 0.03% | 0.06% | 0.08% | 0.16% | 0.30% | 0.43% | 0.18% | |
| EUR | -0.03% | 0.04% | 0.06% | 0.13% | 0.26% | 0.40% | 0.15% | |
| GBP | -0.06% | -0.04% | 0.00% | 0.13% | 0.25% | 0.38% | 0.13% | |
| JPY | -0.08% | -0.06% | 0.00% | 0.09% | 0.22% | 0.36% | 0.11% | |
| CAD | -0.16% | -0.13% | -0.13% | -0.09% | 0.14% | 0.28% | 0.02% | |
| AUD | -0.30% | -0.26% | -0.25% | -0.22% | -0.14% | 0.13% | -0.11% | |
| NZD | -0.43% | -0.40% | -0.38% | -0.36% | -0.28% | -0.13% | -0.24% | |
| CHF | -0.18% | -0.15% | -0.13% | -0.11% | -0.02% | 0.11% | 0.24% |
The heat map shows percentage changes of major currencies against each other. The base currency is picked from the left column, while the quote currency is picked from the top row. For example, if you pick the Japanese Yen from the left column and move along the horizontal line to the US Dollar, the percentage change displayed in the box will represent JPY (base)/USD (quote).
Author

Christian Borjon Valencia
FXStreet
Markets analyst, news editor, and trading instructor with over 14 years of experience across FX, commodities, US equity indices, and global macro markets.

















