GBP/JPY Price Forecast: Bulls test recovery momentum below key moving averages
- The British Pound rises to a three-week high against the Japanese Yen as rate differentials favour Sterling.
- GBP/JPY extends its recovery, but a cluster of moving averages around 211.66-213.54 caps the upside.
- The RSI and MACD signal improving bullish momentum.

GBP/JPY trades on the front foot on Friday, gaining around 0.50% as broad US Dollar (USD) weakness favours the higher-yielding British Pound (GBP) against the lower-yielding Japanese Yen (JPY), which underperforms all its major peers except the Greenback. At the time of writing, the cross trades around 210.66, its highest level since September 22, heading for a third consecutive weekly gain.
Japanese Yen Price Today
The table below shows the percentage change of Japanese Yen (JPY) against listed major currencies today. Japanese Yen was the weakest against the New Zealand Dollar.
| USD | EUR | GBP | JPY | CAD | AUD | NZD | CHF | |
|---|---|---|---|---|---|---|---|---|
| USD | -0.22% | -0.42% | 0.05% | -0.14% | -0.51% | -0.64% | -0.26% | |
| EUR | 0.22% | -0.21% | 0.23% | 0.06% | -0.28% | -0.43% | -0.05% | |
| GBP | 0.42% | 0.21% | 0.46% | 0.31% | -0.07% | -0.20% | 0.18% | |
| JPY | -0.05% | -0.23% | -0.46% | -0.16% | -0.54% | -0.63% | -0.28% | |
| CAD | 0.14% | -0.06% | -0.31% | 0.16% | -0.36% | -0.55% | -0.13% | |
| AUD | 0.51% | 0.28% | 0.07% | 0.54% | 0.36% | -0.13% | 0.27% | |
| NZD | 0.64% | 0.43% | 0.20% | 0.63% | 0.55% | 0.13% | 0.40% | |
| CHF | 0.26% | 0.05% | -0.18% | 0.28% | 0.13% | -0.27% | -0.40% |
The heat map shows percentage changes of major currencies against each other. The base currency is picked from the left column, while the quote currency is picked from the top row. For example, if you pick the Japanese Yen from the left column and move along the horizontal line to the US Dollar, the percentage change displayed in the box will represent JPY (base)/USD (quote).
Meanwhile, growing expectations of a Bank of England (BoE) rate hike by year-end could keep the interest rate differential with the Bank of Japan (BoJ) wide. The gap currently stands at 250 basis points, with the BoE’s policy rate at 3.75% and the BoJ’s at 1.25%.
Focus now turns to a heavy batch of UK economic data next week, including labour market figures, inflation and Retail Sales. On the Japanese side, traders await national Consumer Price Index (CPI) data.
Technical analysis
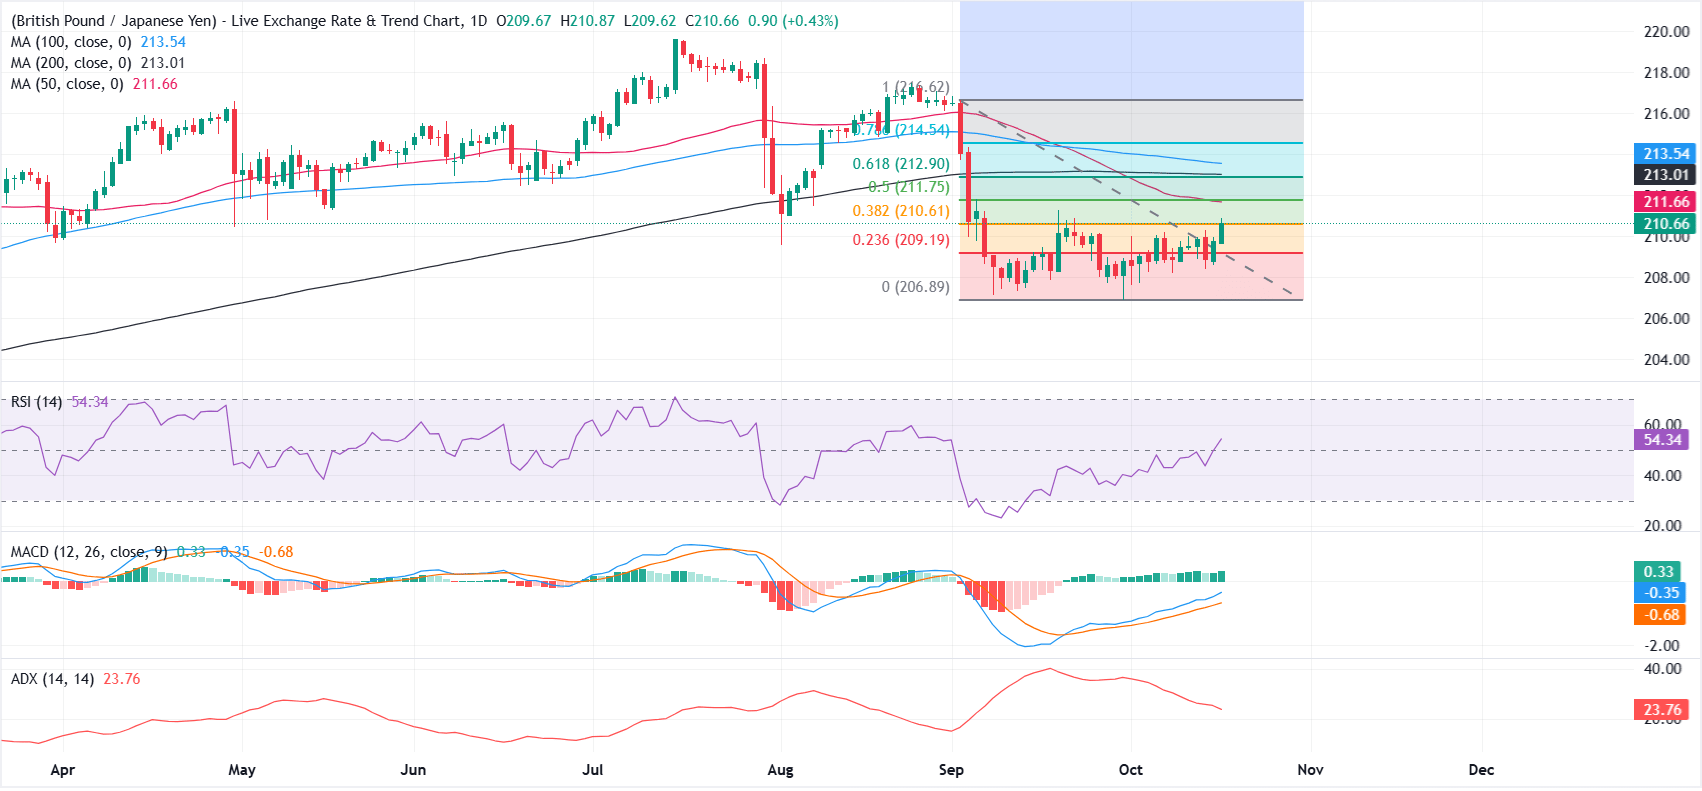
On the daily chart, GBP/JPY trades below the 50-day Simple Moving Average (SMA) at 211.66 and the 100-day SMA at 213.54, which keeps the cross in a capped, near-term bearish bias despite the latest bounce. The 200-day SMA at 213 reinforces a dense overhead barrier together with the 50.0% and 61.8% Fibonacci retracements at 211.75 and 212.90.
Momentum is constructive, with the Relative Strength Index (RSI) hovering around 54 and the Moving Average Convergence Divergence (MACD) above zero with a positive line, yet the modest Average Directional Index near 24 hints that trend strength is fading rather than accelerating.
On the topside, immediate resistance is seen at the 50-day SMA at 211.66, followed closely by the 50.0% Fibonacci retracement at 211.75, while the 61.8% retracement at 212.90 and the 200- and 100-day SMAs at 213.01 and 213.54 build a broader supply zone ahead of the 78.6% level at 214.54. On the downside, initial support appears at the 38.2% retracement at 210.61, with further demand expected at the 23.6% level at 209.19 and the structural low around 206.89; as long as price remains under the cluster of medium- and long-term averages, rallies are likely to be sold into these nearby resistance bands.
(The technical analysis of this story was written with the help of an AI tool. Know more.)
Bank of Japan FAQs
The Bank of Japan (BoJ) is the Japanese central bank, which sets monetary policy in the country. Its mandate is to issue banknotes and carry out currency and monetary control to ensure price stability, which means an inflation target of around 2%.
The Bank of Japan embarked in an ultra-loose monetary policy in 2013 in order to stimulate the economy and fuel inflation amid a low-inflationary environment. The bank’s policy is based on Quantitative and Qualitative Easing (QQE), or printing notes to buy assets such as government or corporate bonds to provide liquidity. In 2016, the bank doubled down on its strategy and further loosened policy by first introducing negative interest rates and then directly controlling the yield of its 10-year government bonds. In March 2024, the BoJ lifted interest rates, effectively retreating from the ultra-loose monetary policy stance.
The Bank’s massive stimulus caused the Yen to depreciate against its main currency peers. This process exacerbated in 2022 and 2023 due to an increasing policy divergence between the Bank of Japan and other main central banks, which opted to increase interest rates sharply to fight decades-high levels of inflation. The BoJ’s policy led to a widening differential with other currencies, dragging down the value of the Yen. This trend partly reversed in 2024, when the BoJ decided to abandon its ultra-loose policy stance.
A weaker Yen and the spike in global energy prices led to an increase in Japanese inflation, which exceeded the BoJ’s 2% target. The prospect of rising salaries in the country – a key element fuelling inflation – also contributed to the move.
Author

Vishal Chaturvedi
FXStreet
I am a macro-focused research analyst with over four years of experience covering forex and commodities market. I enjoy breaking down complex economic trends and turning them into clear, actionable insights that help traders stay ahead of the curve.

















